Using Polls to Predict Elections
September 23, 2020
Introduction
Switching gears from last week’s blog post on the economy, this week’s blog post focuses on the predictive power of polls. First, I will show and evaluate a model that focuses on nation-level polls. Then, I will compare that model to models built on a state-by-state basis. Finally, I will use these models to predict the 2020 election
Model 1: National Level Polls
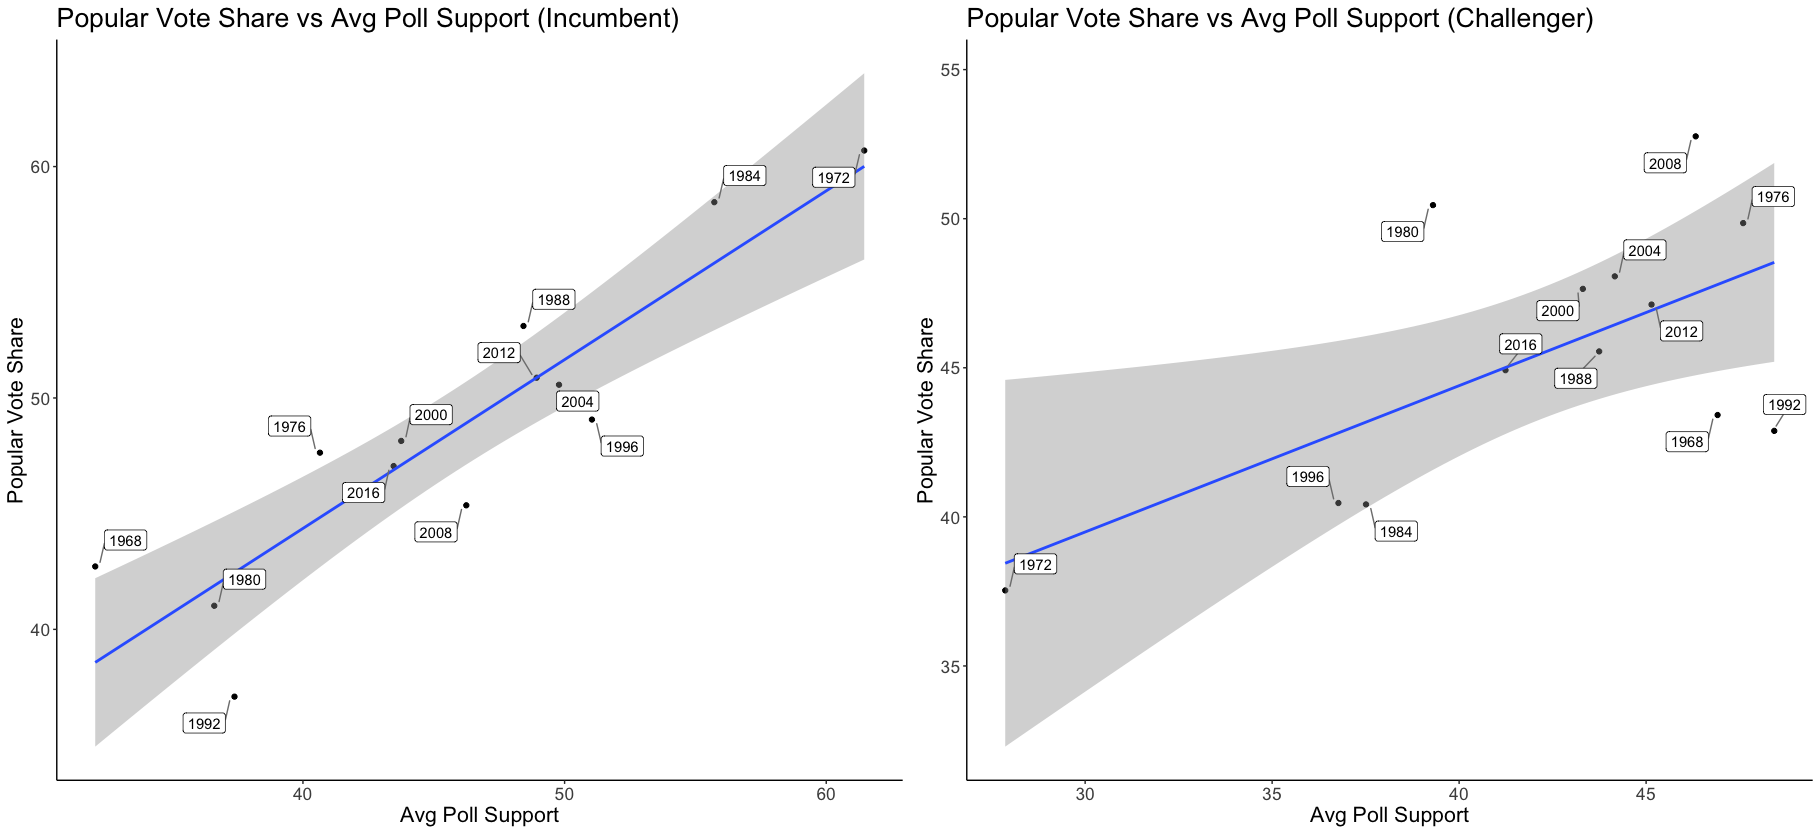
Although I call this section model 1, it really discusses two models: one for incumbent vote share and one for challenger vote share. Ultimately, I will combine the results of the two models in my prediction. In the case of 2020, the incumbent model will be used to predict Trump’s popular vote share and the challenger model will be used to predict Biden’s popular vote share. For each model, I ran a linear regression of popular vote share vs. average poll support.
The independent variable, average poll support,
was calculated by taking the average result from each poll six weeks out from the election
in every year (i.e. the average support in 2008 would be equal to the average result of every poll from 2008
taken about six weeks out from the election in the data set). I only include polls taken six weeks
out from the election because, as of today (9/23/2020), we are about six weeks away from the 2020
election. Moreover, polls become increasingly better predictors of the election as they get
closer to the election, so it makes sense to focus on the most recent data we have available (as of today, that is polls
about six weeks away from the election). The results of the two regressions (incumbent and challenger) are
shown below.
Model Analysis: summary and in sample fit
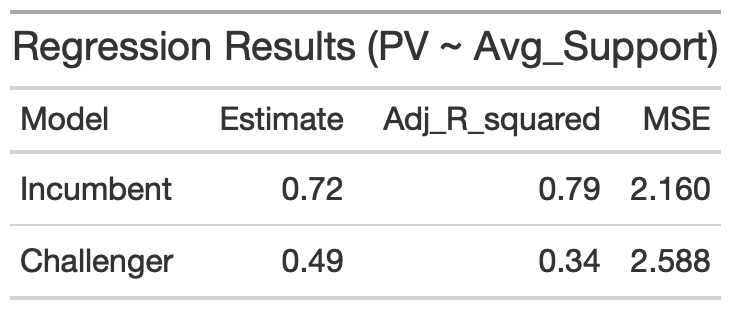
The regression results for both the incumbent and challenger models are shown below.
Analysis
- The Adjusted R Squared is better for the incumbent model but still decent for the challenger model
- Both models have fairly low Mean Squared Errors
- Overall, the in sample fit for both of these models is promising
Model Analysis: out of sample fit
In order to avoid overfitting the model to historical data, I used leave-one-out cross validation to evaluate the model’s out-of-sample performance. The cross validation process includes taking one election year out of the data, building a model without that year’s data, and then using the model to predict the left out election. The prediction is considered “correct” if the model correctly predicts the winning party in the election (the winning party is whichever party (incumbent or challenger) has the higher popular vote).
The national polls model has a classification accurracy of 0.900, meaning that the model correctly predicted 90% of elections in the cross validation process.
Model 2: State Level Polls
The national poll model appears to be a good predictive model based off of its in-sample and out-sample summary statistics. However, the American presidential election is not decided by the national popular vote, but rather the electoral college. Thus, it could be more informative to predict the election on a state-by-state basis. In order to build this state model, I ran linear regressions for each individual state using historical polling data from that state. As with the national model, I built both an incumbent and challenger model for every state.
The independent variable for each regression is calculated by taking the mean of every poll taken six weeks out from the election in each state for a given election year. However, unlike national-level polls, there is not data available for every election year for every state. This lack of data has some important implications. First, for almost every state, there are fewer data points to run a regression on compared to the national model. Second, in order to ensure there is data on at least three election years for every state, I had to include the results of polls taken seven weeks away from the election when calculating the average support variable (this was the case for Idaho, Delaware, Alaska, Utah, DC, Georgia, Mississippi, South Dakota, Wyoming, Hawaii, Kentucky, and North Dakota). For Idaho, Wyoming, and DC, I had to include polls taken eight weeks away from the election. This is significant because, as discussed above, polls become less predictive the farther away they get from the election.
Model Analysis: regression results and in sample fit
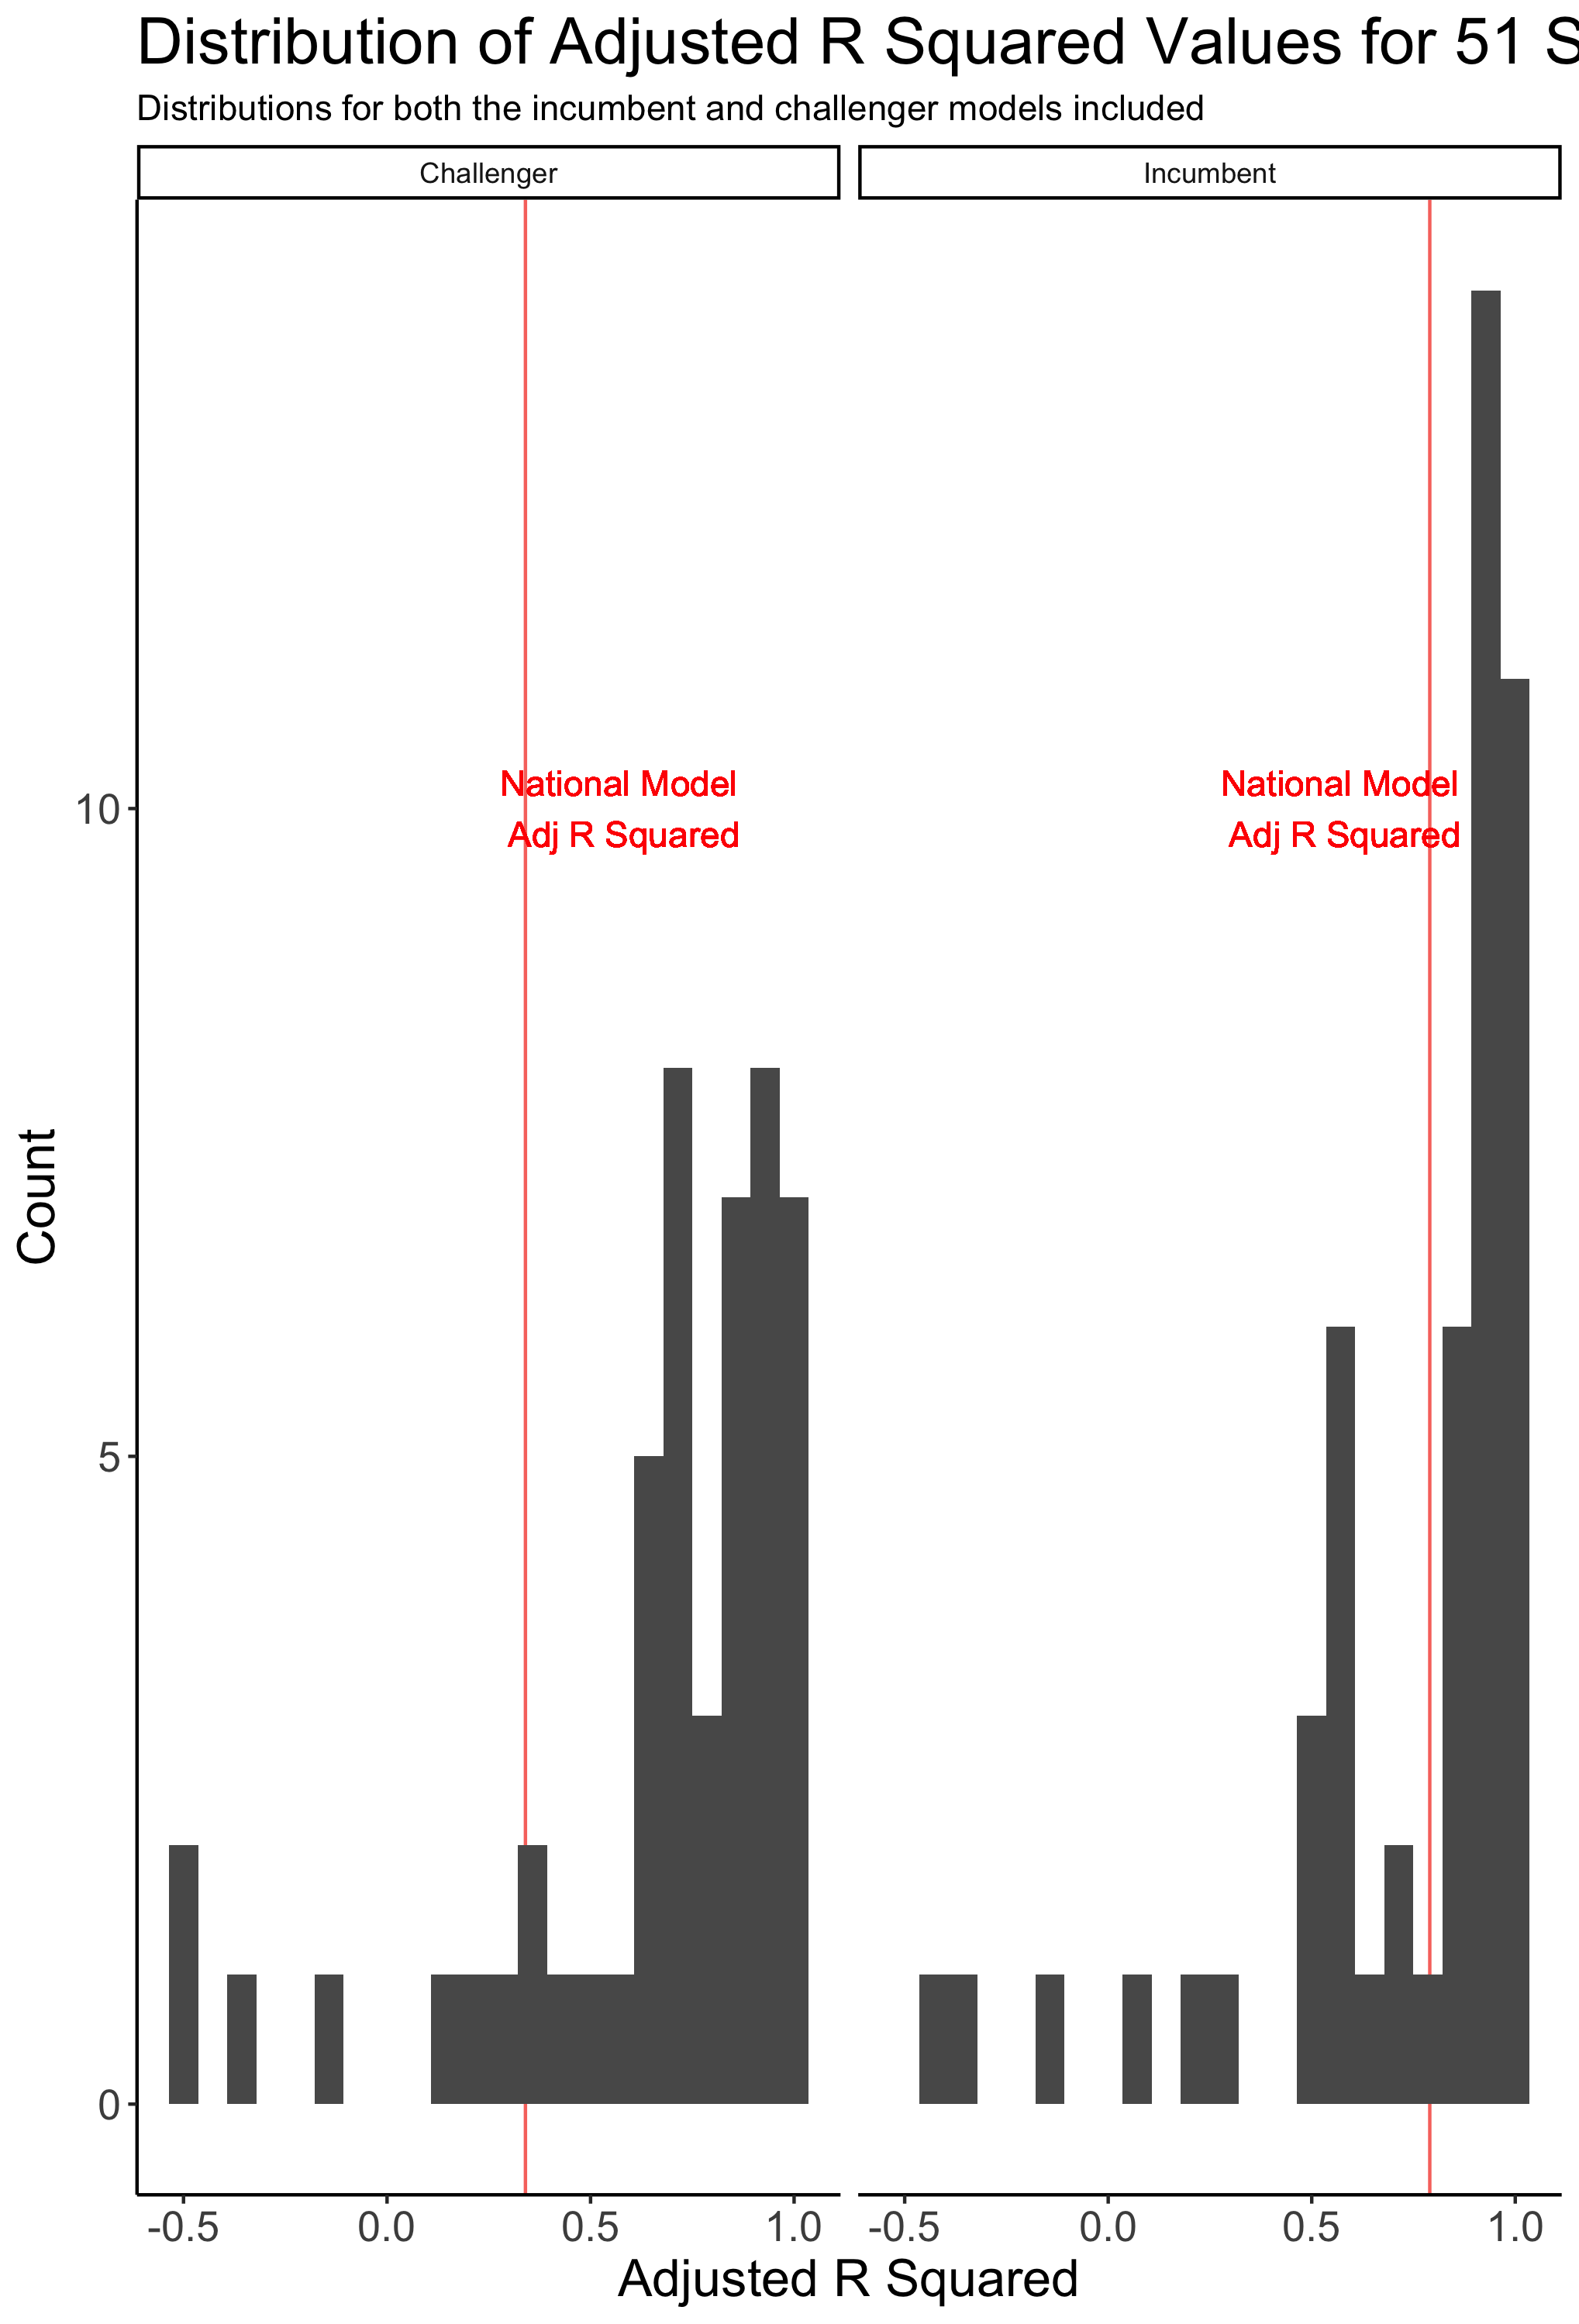
The histogram below shows the distribution of Adjusted R Squared values for all incumbent and challenger state models.
Analysis
- The Adjusted R Squared value varies across each model but is generally strong
- While some models have a lower Adj R Squared than the national model, the majority of state models have a stronger Adj R Squared
- However, too high of an R-squared could imply that the model is overfit to historical data and will break down when used to predict
- To test the models’ predictive power, I performed leave-one-out cross validation for each model as I did with the national model
Model Analysis: out of sample fit/cross validation results
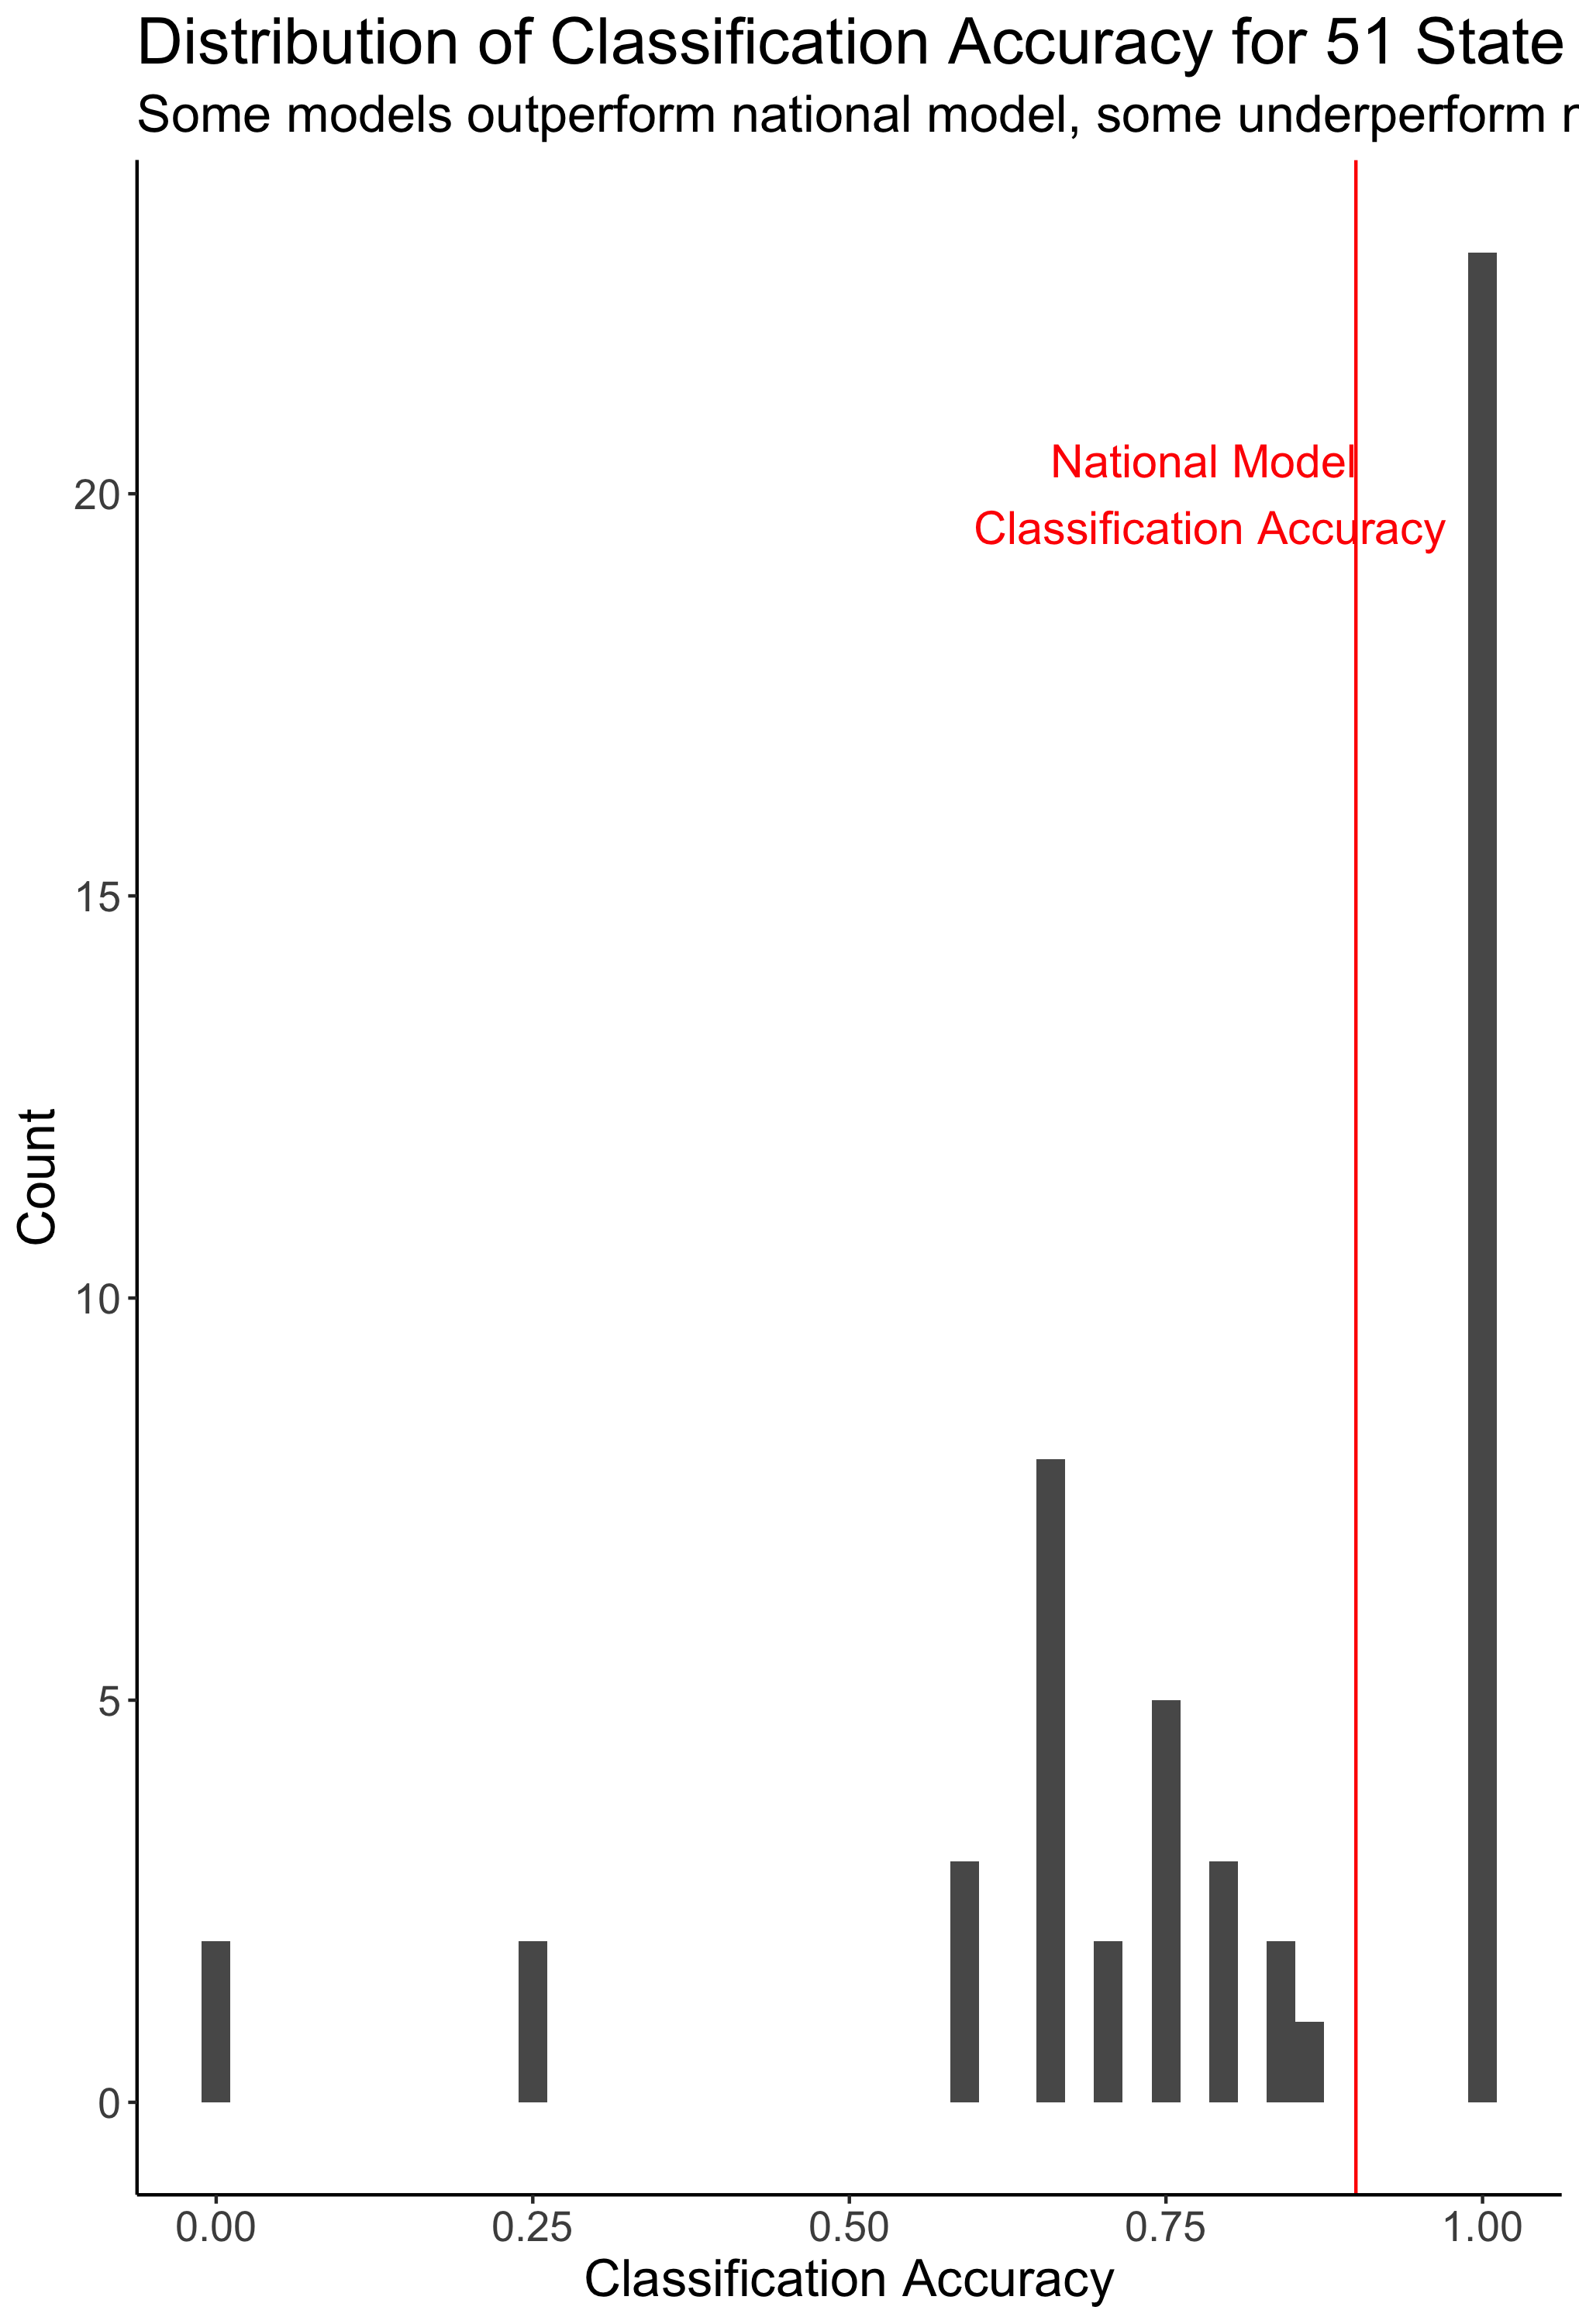
The histogram below displays the distribution of mean classification accurracies for each state model.
Analysis
- The classification accuracy is higher for many of the state models than for the national model, with 23 states predicting the correct winner 100% of the time
- On the other hand, 23 state models have a classification accuracy below 70%
- Some state models (notably Florida) have a classification accuracy of 25%, some have a classification accuracy of 0%
- The classification accuracy is very high for some [key battleground states] such as North Carolina (100%) and Georgia (87.5%) and very low for others (Florida)
Predicting the 2020 Election with National and State-by-State Model
Based off of the average of national poll results (for polls taken six weeks from the election) taken from 538, Model 1 predicts that Biden will win the election with 49.46% of the popular vote and Trump will lose the election with 46.83% of the popular vote.
Model 2 predicts the election state-by-state – it predicts that Biden will win the election with 377 electoral votes and Trump will lose the election with 161 electoral votes. See the map below for results.
Note: Unfortunately, there is not polling data available for all states in 2020. The states without data are Illinois, Nebraska, Rhode Island, South Dakota, Vermont, Wyoming, and DC. Fortunately, none of these states are expected to have tight races or be swing states, so it should be safe to use results from 2016 as a proxy for results in 2020 for the purpose of allocating those states’ electoral votes to a candidate.
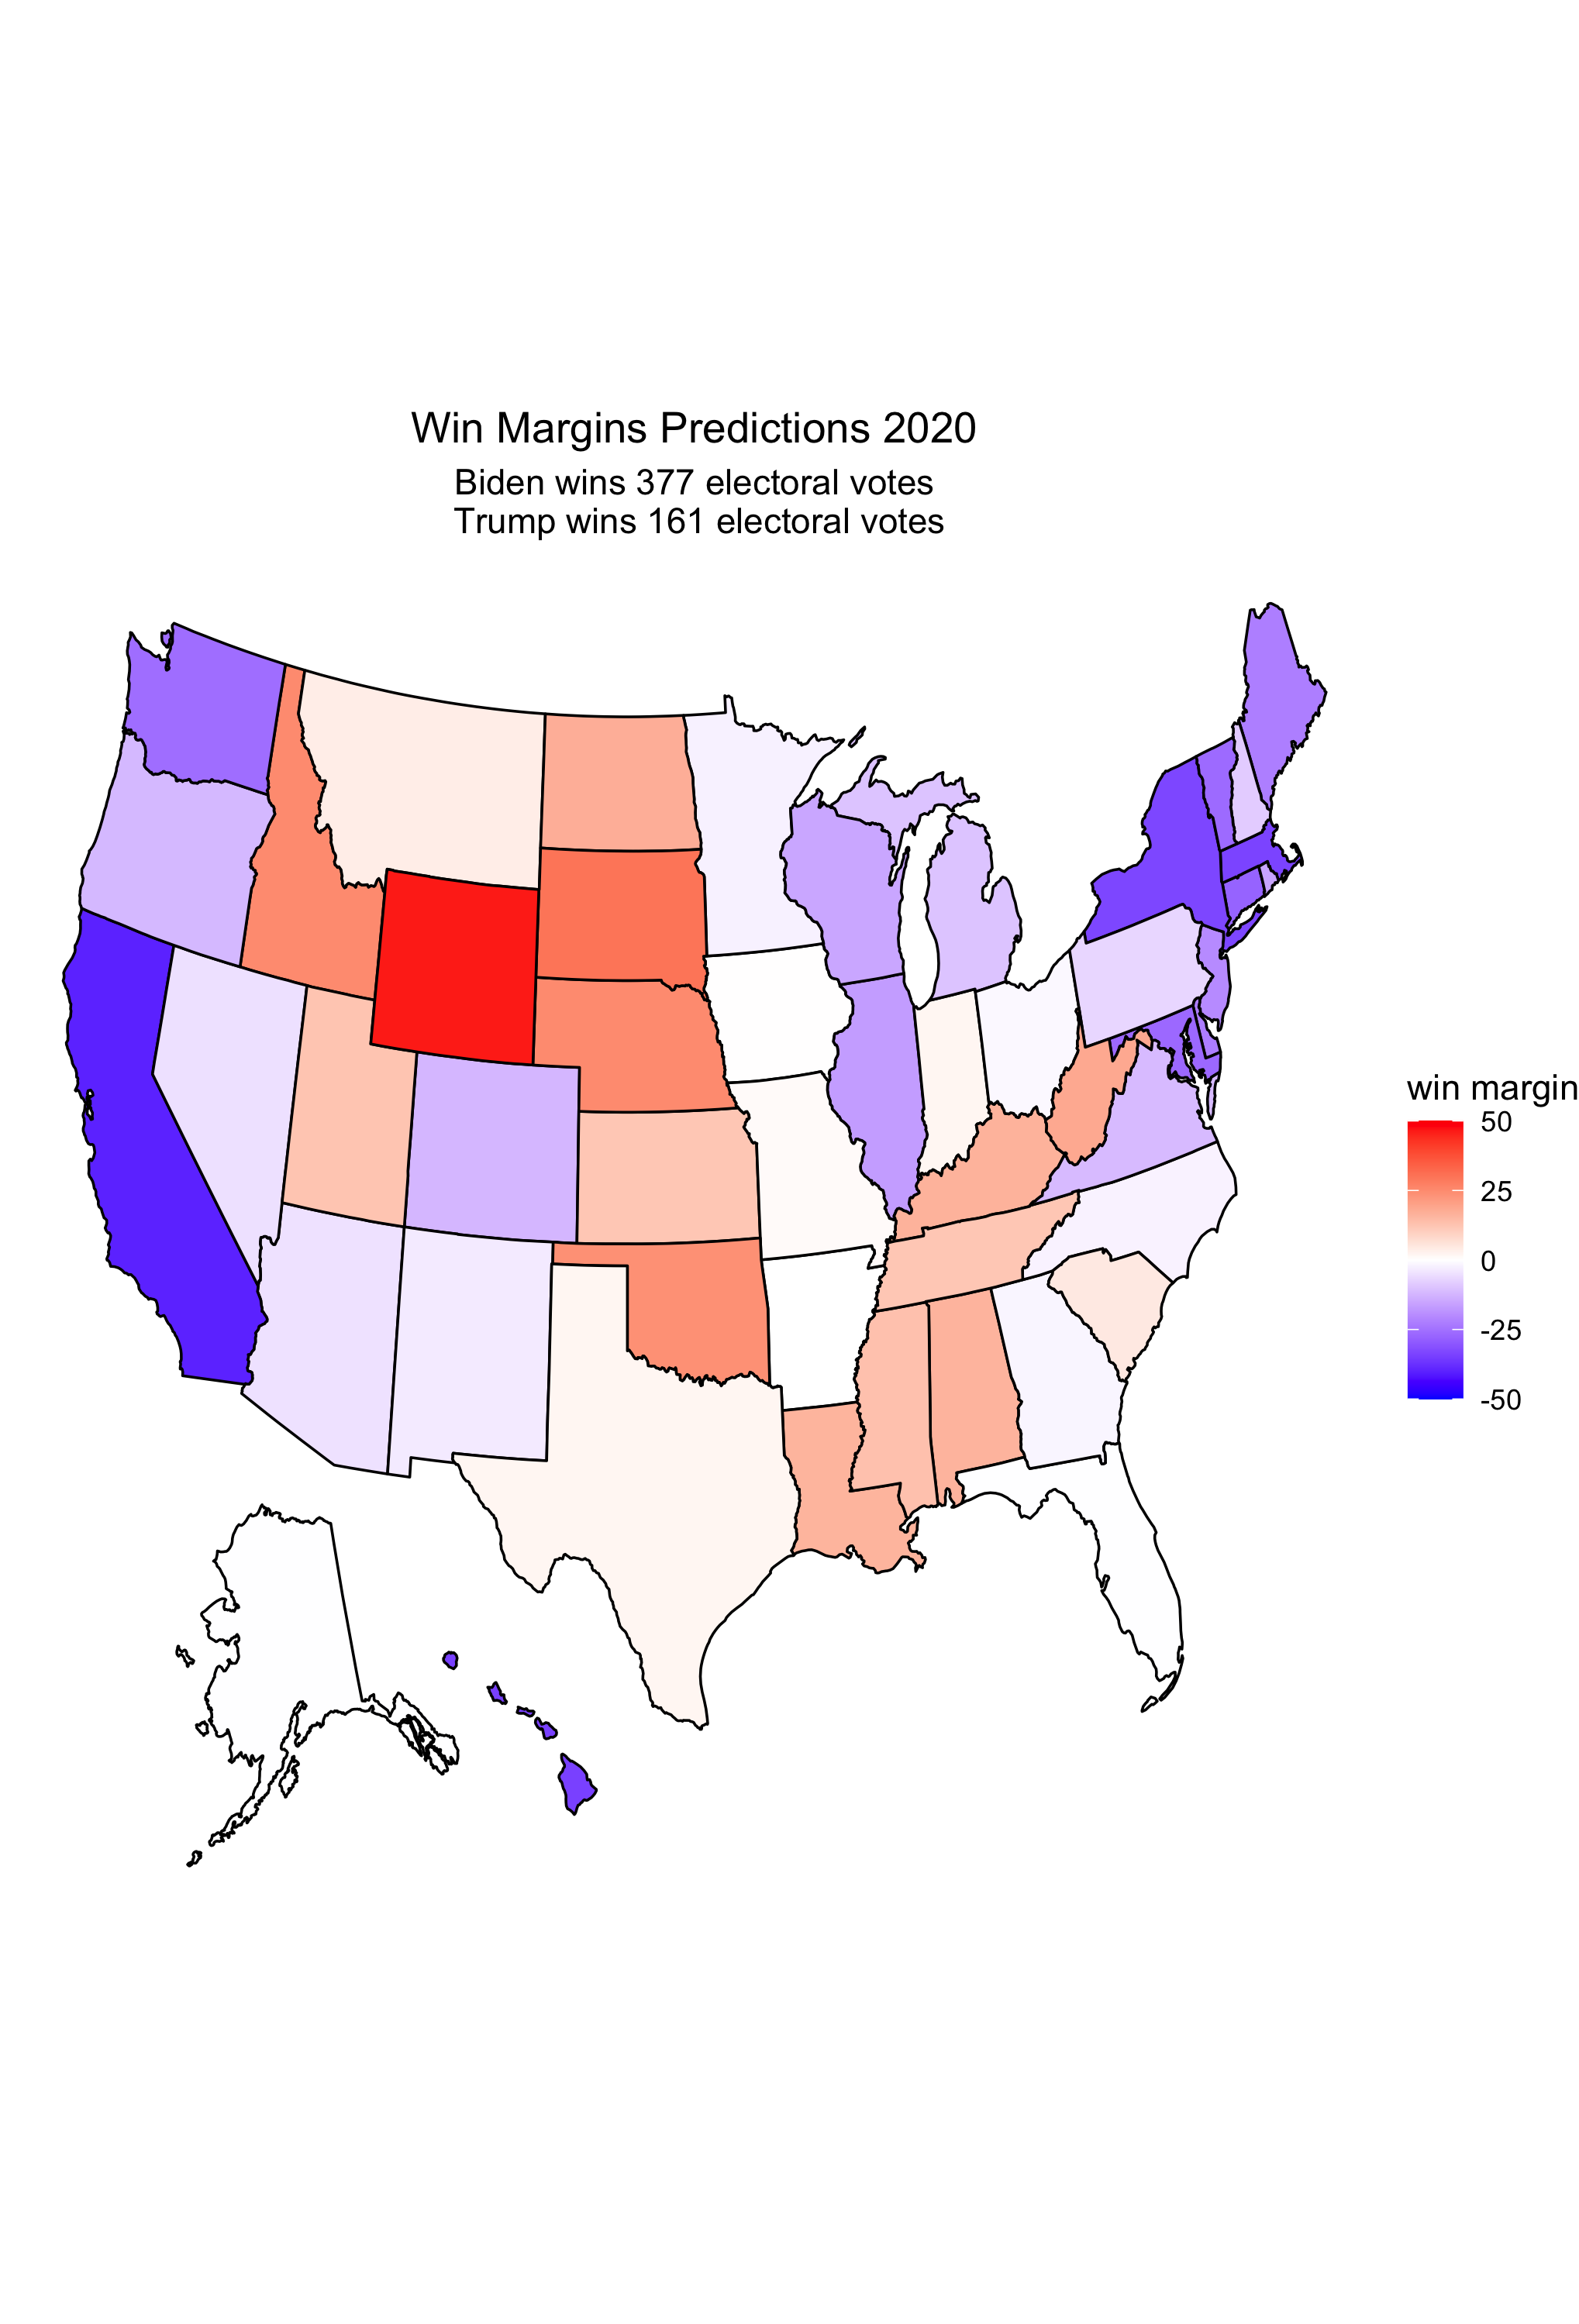
Analysis
- The state-by-state model presents unexpected results in some states that are thought to be reliably republican
- For example, the model has Biden winning Alaska by .28% and Arkansas by .07%
- The model also predicts some very tight races in key swing states
- For example, the model has Biden winning Florida with a .25% win margin, Georgia with a 1.73% win margin, and North Carolina by a 2.08% win margin
- If any of these states go republican, the results of the election could be a lot closer than this model predicts
Conclusion
Both models predict that Biden will win the election, with the state model predicting a land slide win for the democrats and the national model predicting a tighter race. There are pros and cons of both the state and the national model. One major con of the state model is that there is less data to build models from. However, I believe it is more telling to predict the election on a state-by-state basis due to the electoral college system.
In normal (non-pandemic) times, it would be interesting to build a model based off of both economic and polling data. However, because of the extremity of today’s economy (see last weeks’s blog post), that would difficult.
In the coming weeks, I will work to build a model based off of other predictive variables in addition to polling data.