How Ad Spending could Change the Election
October 10,2020
Introduction
This week’s blog post will look at how Trump can leverage spending on media ads to gain an edge in the election. First, I will discuss some changes in the form of the poll model I have used in the past few weeks. Next, I will use the updated model to simulate the 2020 election. Finally, I will discuss the potential effects of ad spending on vote share in a few key swing states (Wisconsin, Florida, and Georgia).
Updating the Poll Model
This week’s model is a binomial logit model, not a linear regression. I made this change because probabalistic models, like the binomial model, restrict the boundaries of prediction from 0 to 100, which more accurately represents vote share possibilities (prior models had prediction intervals reach below 0% or above 100%). The model works by predicting the probability of each voter in the eligible voter population in each state to turn out for a candidate. The independent variable is still the average poll support in each state, however, I have updated those numbers to reflect polls five weeks out from the election, not six.
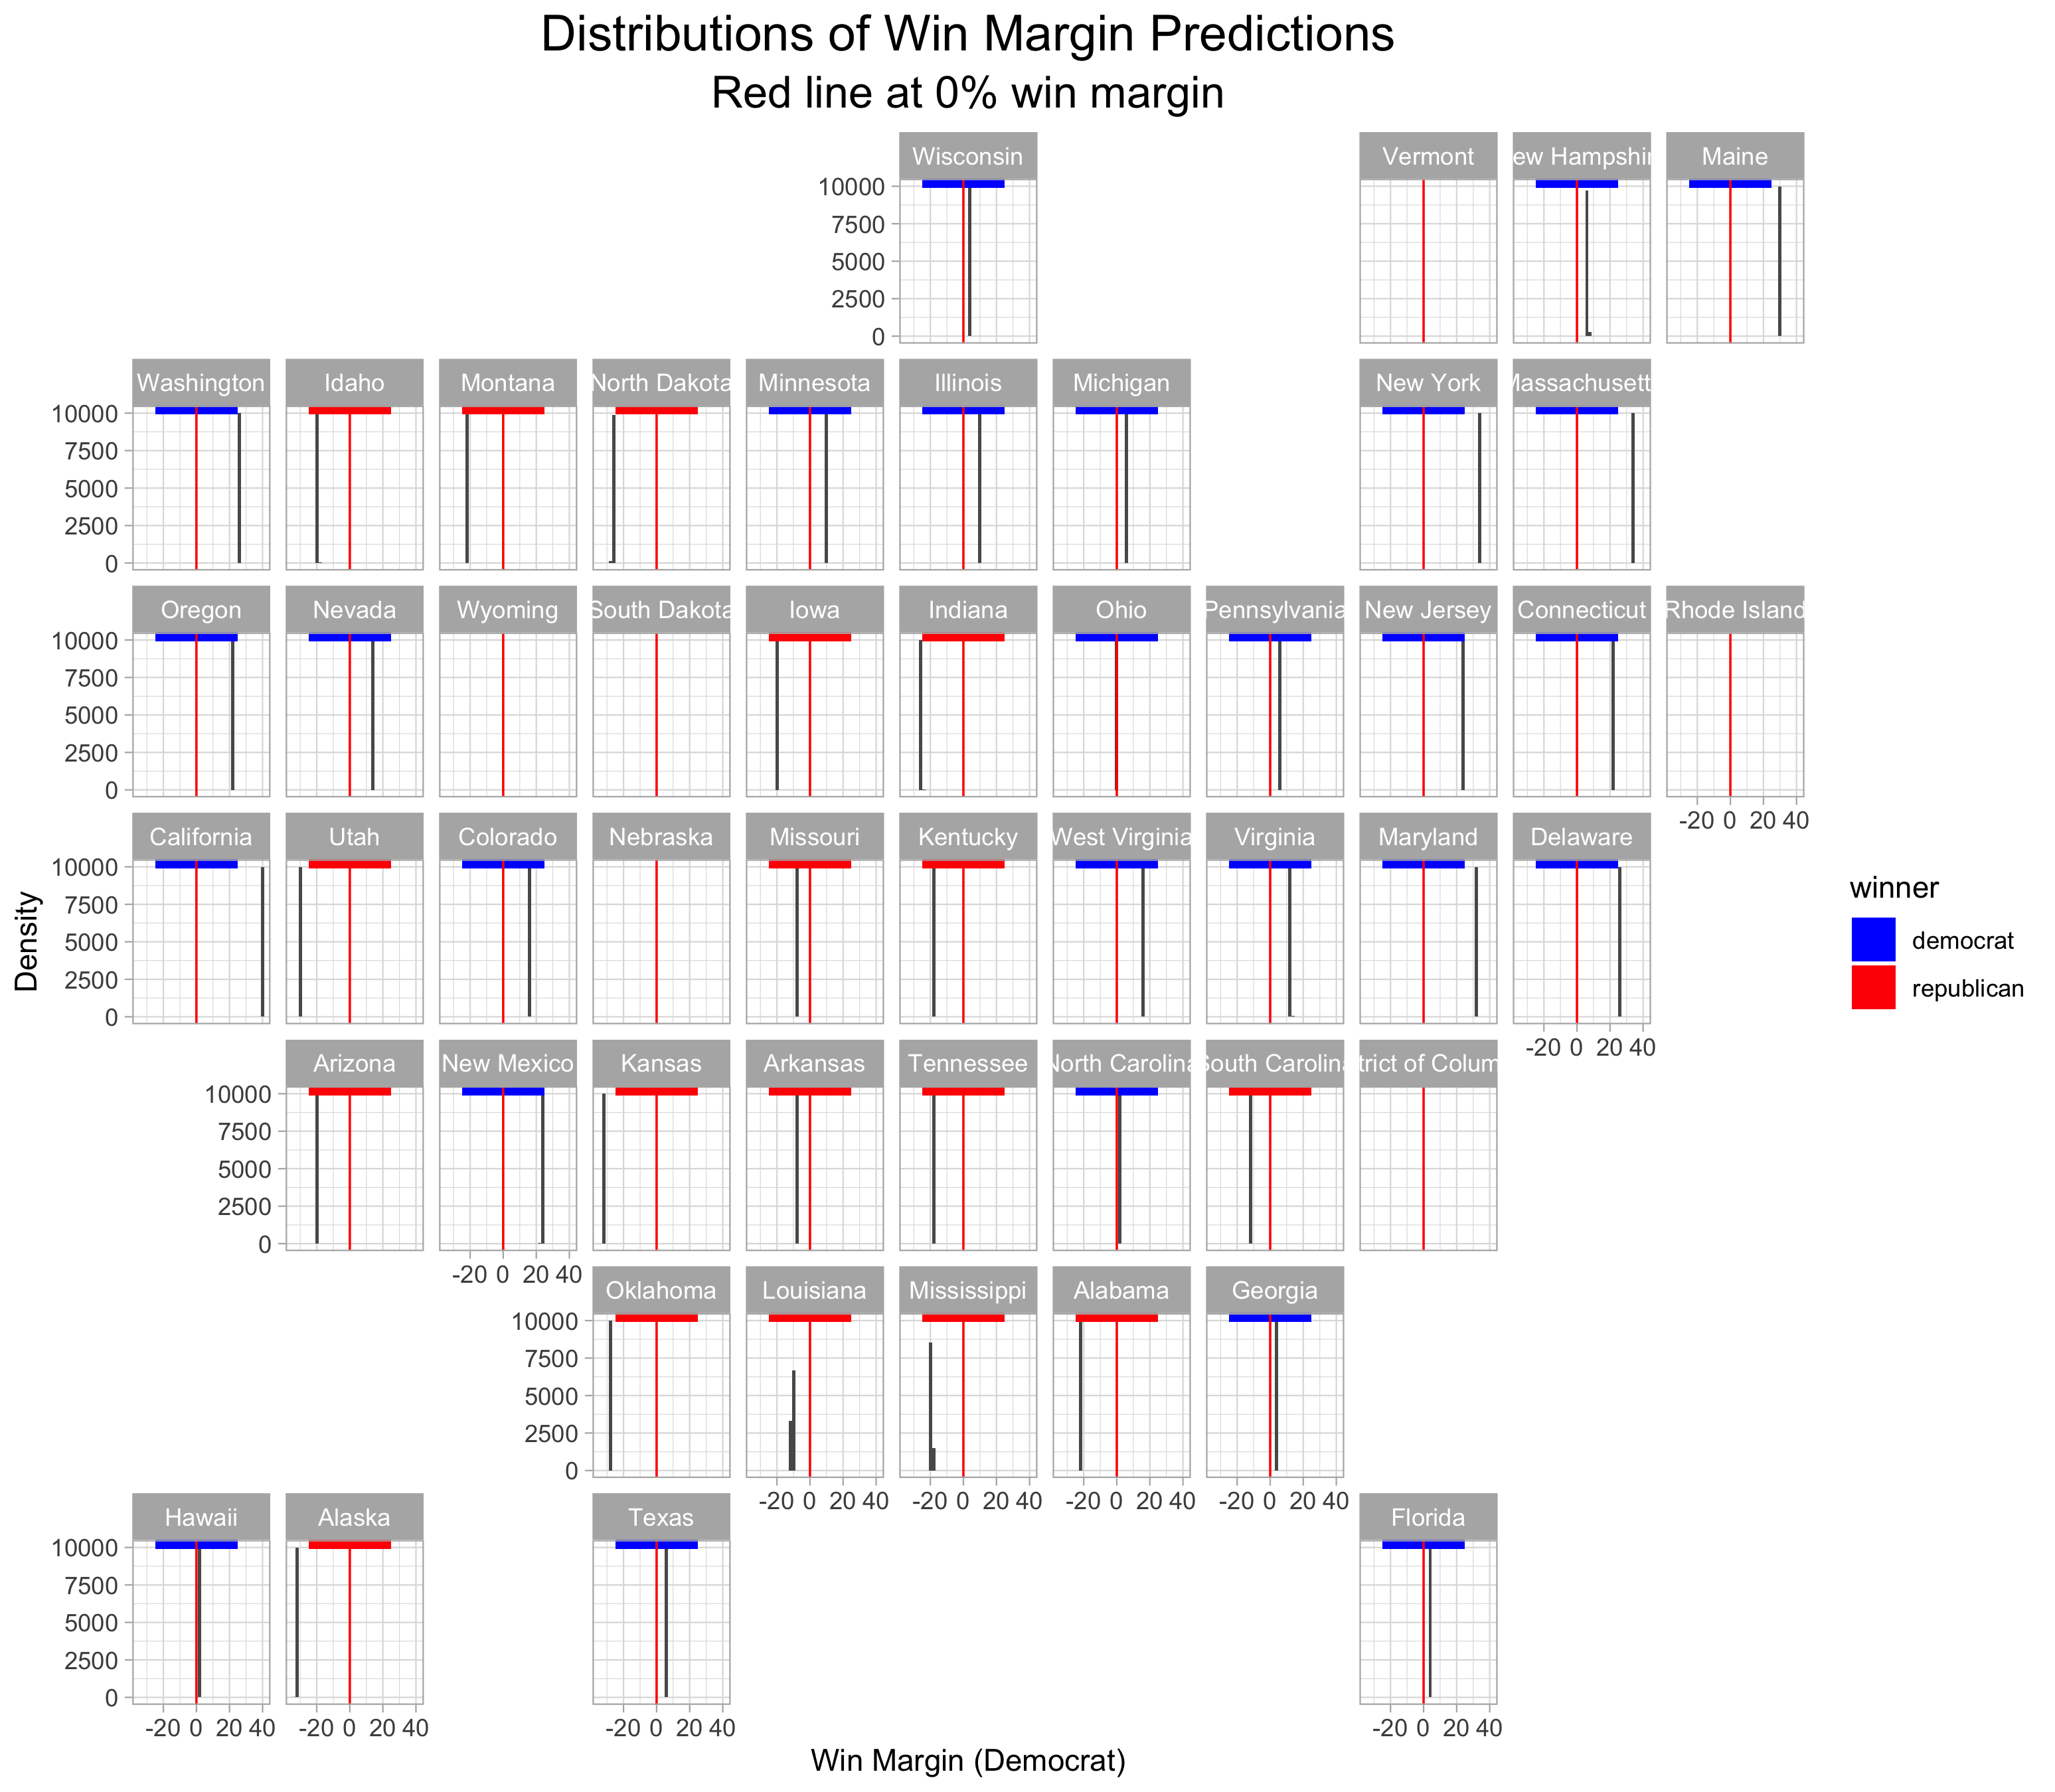
I ran a binomial logistic regression for each state with historical polling data. Using these models, I ran 10,000 simulations of the 2020 election based off of the current poll averages from 538. The simulations show the predicted win margins in each state based off of the predicted draw of the voter eligible population for Biden and Trump. The map below shows the distributions of the results from these simulations.
Analysis
- Taking the means of these distributions as the predicted win margin, the model predicts that Biden wll win with 400 electoral votes and Trump will lose will 138 electoral votes
- It is worth being skeptical about some of these simulations, as some results seem unrealistic
- For example, the model has Trump winning Arizona by double digits when my past models, as well as other poll based models have Biden winning Arizona
- This model also has Biden winning Texas, where all my past models have Trump winning Texas, and many professional models predict that Trump will most likely win in Texas
- The model also predicts that Biden will win West Virginia when West Virginia will almost certainly vote for Trump
- The model predicts slim margins in swing states such as Florida, Georgia, Ohio, Wisconsin, New Hampshire, and Michigan
- The model predicts Biden’s win to be more decisive than last week’s Covid-19 model
Note: There is not poll data available to build models for a few states (Vermont, Wyoming, South Dakota, Rhode Island, Nebraska, and DC). However, as was the case in prior blog posts, I believe it is a safe bet to use prior election results in these states as a proxy for 2020.
Looking at Key Swing States
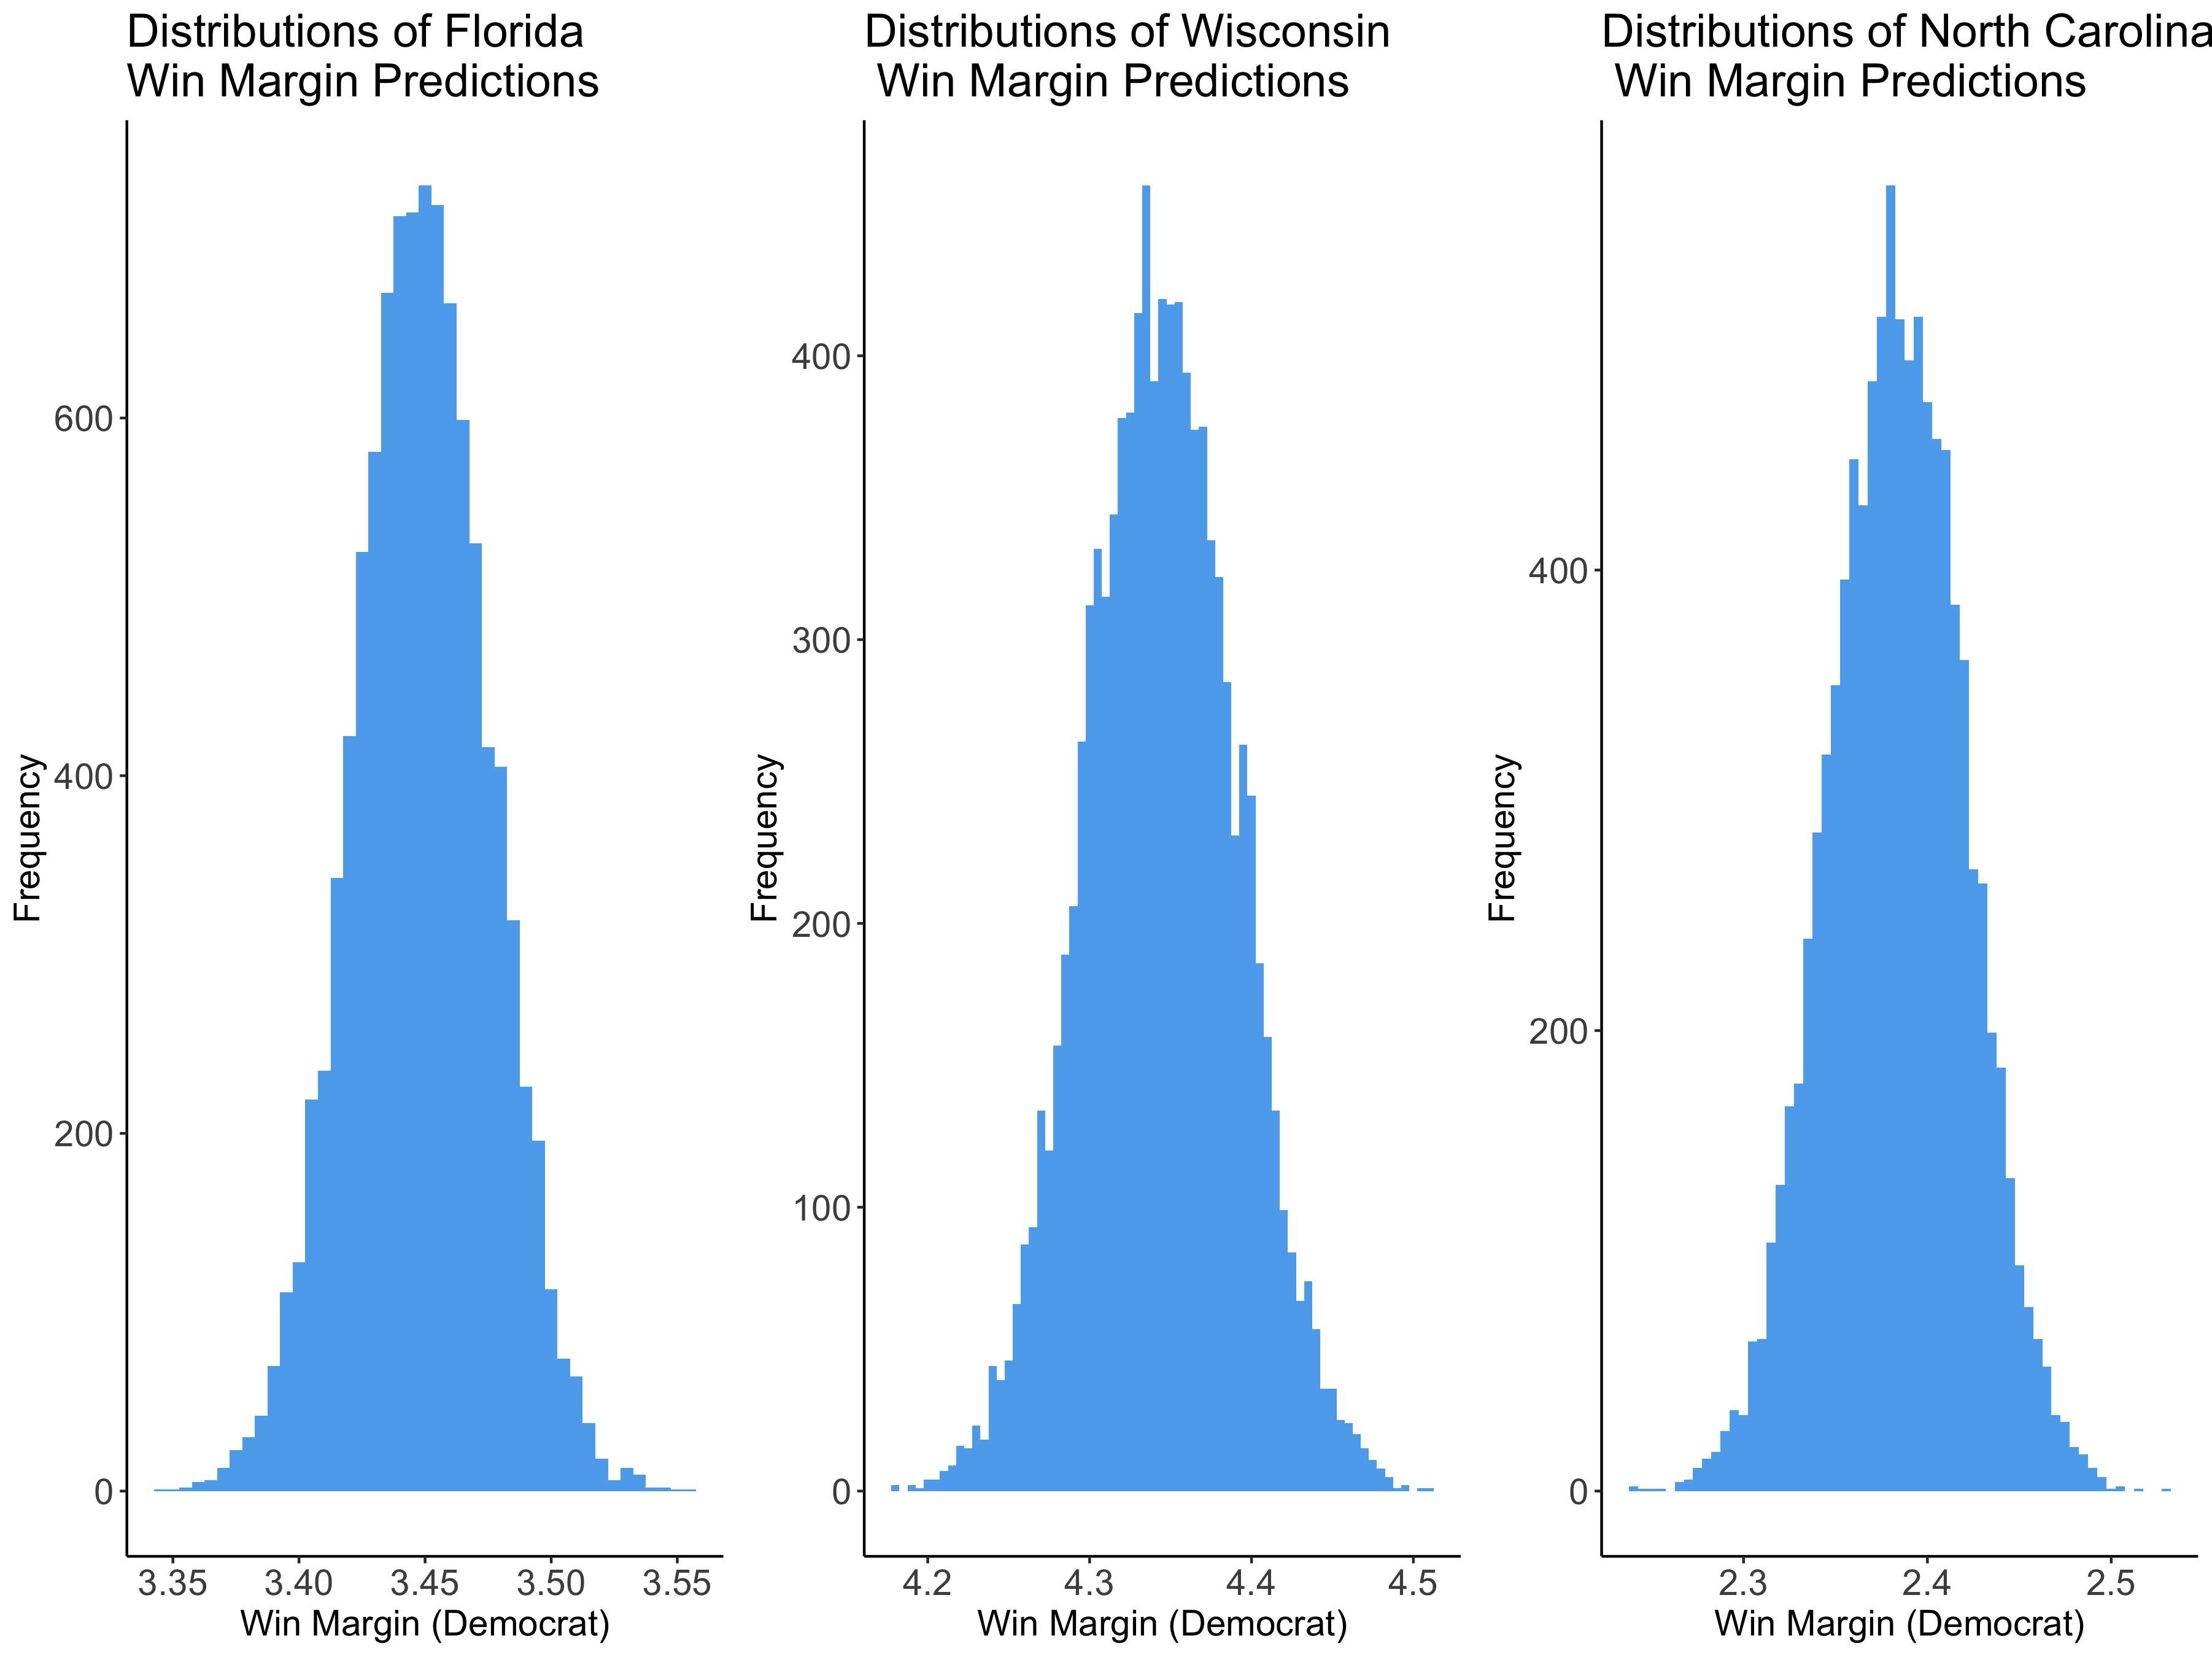
The graphic below shows the distributions for North Carolina, Florida, and Wisconsin.
Analysis
- The model estimates Wisconsin’s win margin at just below 4.5%
- The model estimates Florida’s win margin at just below 3.5%
- The model estimates North Carolina’s win margin at just below 2.5%
Shifting the Win Margin with Ad Spending
According to 2011 research by Alan Gerber and 2007 research by Gregory Huber, political advertising campaigns can have persuasive effects on voters. Specifically, both of these studies find that investment in Gross Point Rating (a marketing term that referes to the number of airings of an ad multipleid by the percent of reachable audience), leads to an increase in vote share. Specifically, Gerber estimates that an addition of 1,000 GRPs over an opponent buys a 5 point shift in vote share (with a standard error 1.5%), and Huber estimates that an addition of 1,000 GRPs over an opponent buys a 7.5 point shift in vote share (with a standard error of 2.5%).
Using these estimates, and knowing that 1 GRP costs about $300, we can calculate how much Trump would have to spend to win these swing states.
Wisconsin: Looking at the distribution above, Trump would have to gain about about 6.5% vote share to have about a 2% win margin. According to Gerber, this translates into Trump needing about 1,300 more GRPs than Biden going into the election. According to Huber, this translates into Trump needing about 866 more GRPs than Biden going into the election. This equates to Trump having to spend $390,000 or $259,800 more on ads than Biden.
Florida: Looking at the distribution above, Trump would have to gain about about 5.5% vote share to have about a 2% win margin. According to Gerber, this translates into Trump needing about 1,100 more GRPs than Biden going into the election. According to Huber, this translates into Trump needing about 733 more GRPs than Biden going into the election. This equates to Trump having to spend $330,000 or $219,900 more on ads than Biden.
North Carolina: Looking at the distribution above, Trump would have to gain about about 4.5% vote share to have about a 2% win margin. According to Gerber, this translates into Trump needing about 900 more GRPs than Biden going into the election. According to Huber, this translates into about Trump needing about 600 more GRPs than Biden going into the election. This equates to Trump having to spend $270,000 or $180,000 more on ads than Biden.
Visualizing shifts
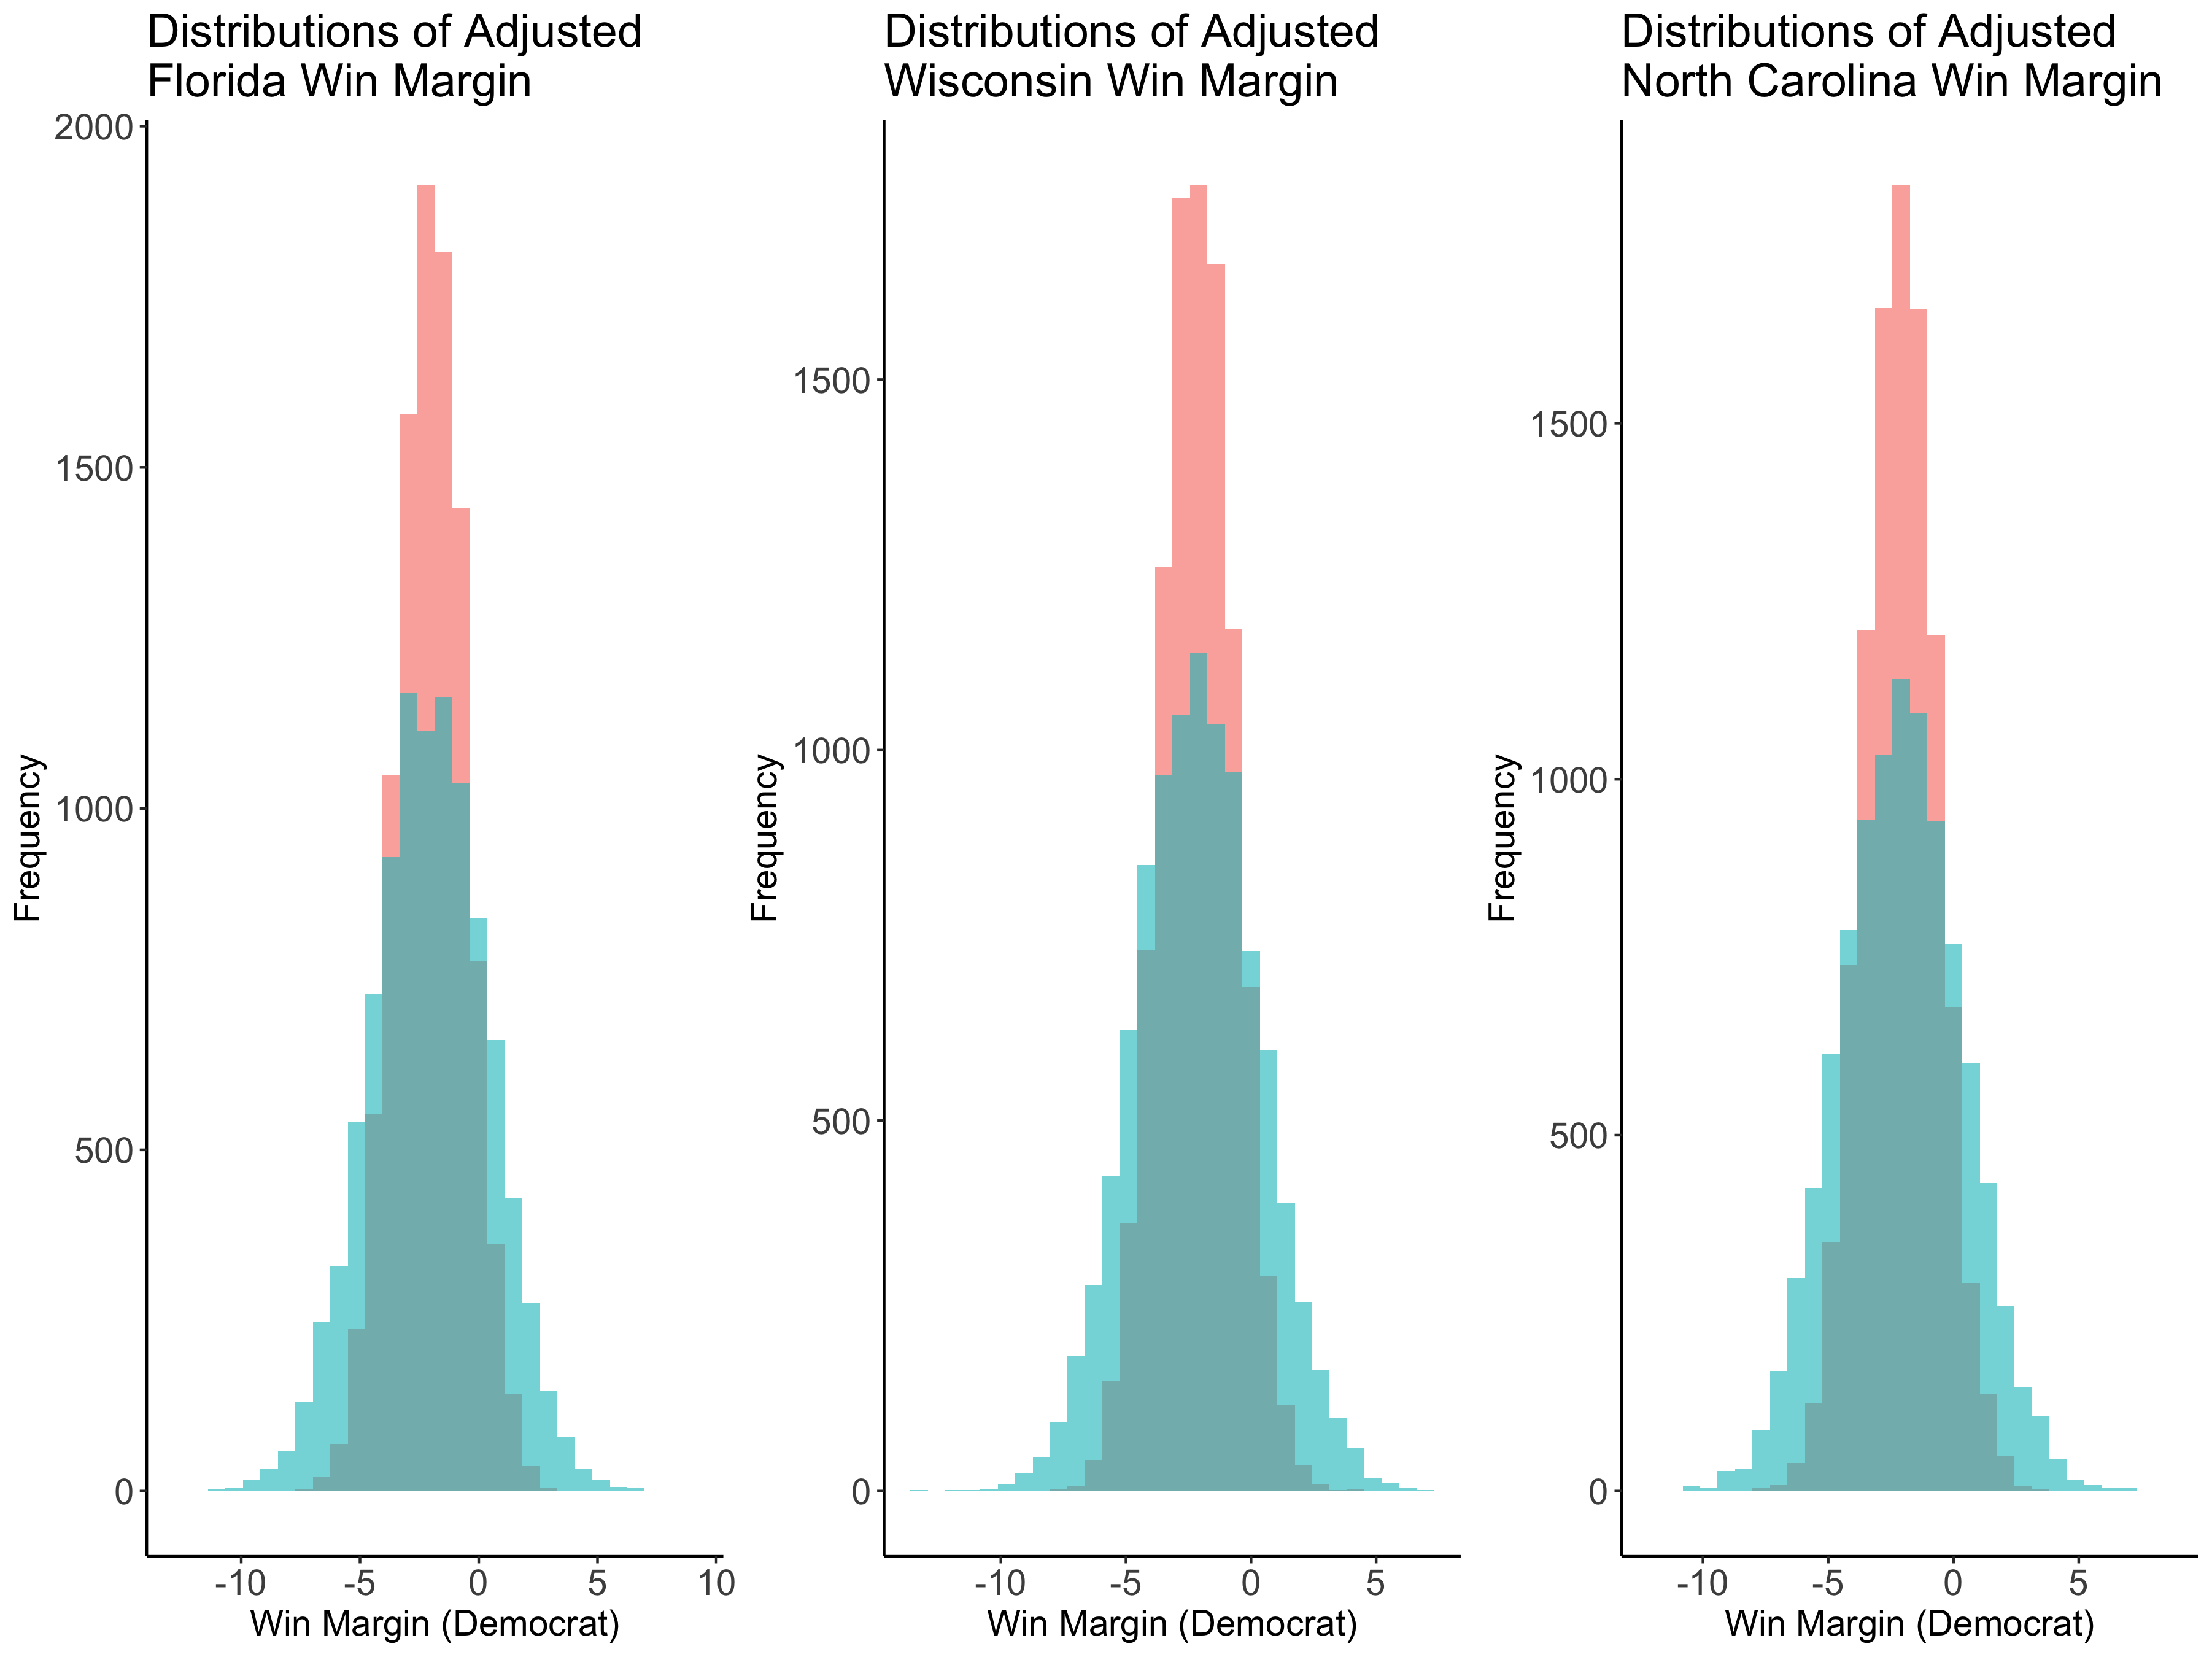
The graphic below shows the previous distributions adjusted for the spending addressed above. The two different distributions are reflective of either Gerber’s (red) or Huber’s (blue) estimates. Huber’s estimates have a larger standard error than Gerber’s estimates. All shifts results in a rough 2% win margin for Trump.
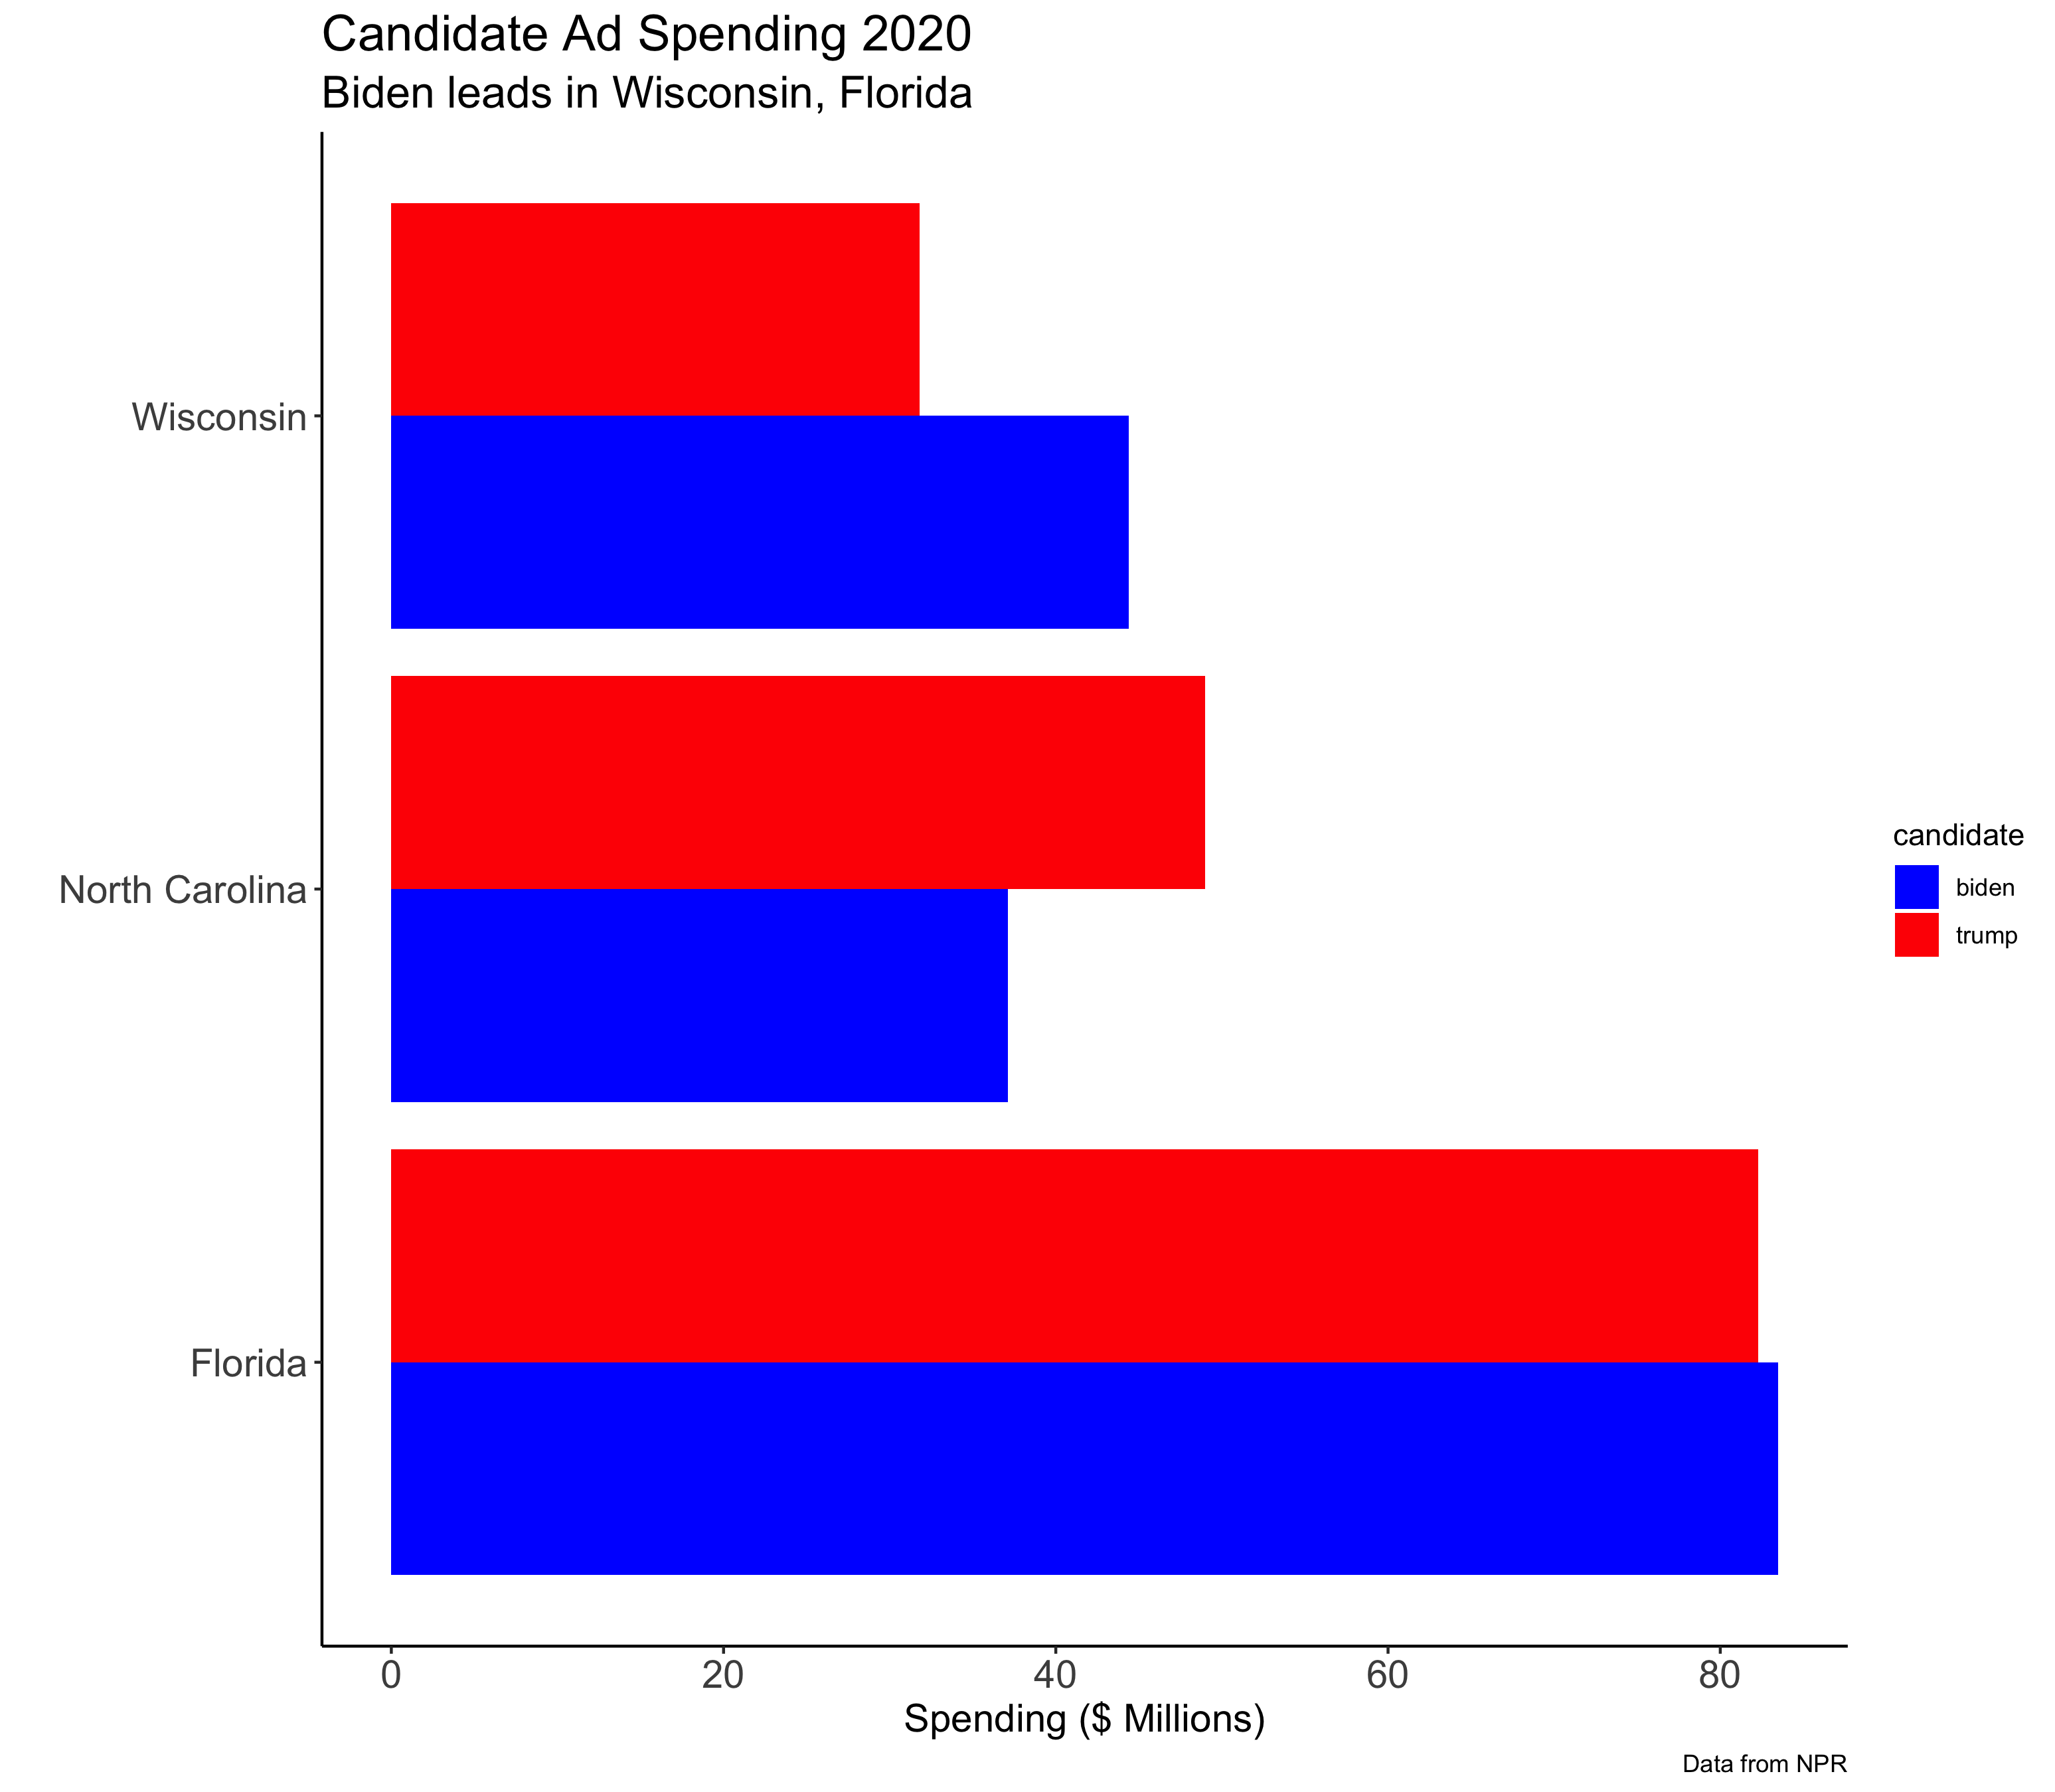
What does the current spending data look like?
As of now, Biden is outspending Trump in both Florida and Wisconsin, meaning that it would be potentially difficult for Trump to spend as much as he needs to in order to shift the vote in his direction.
Conclusion
With regards to the prediction, the new probabalistic model predicts the election to be a landslide for Biden. However, some of the predictions seem incorrect (see analysis above) and I am wary to use this model going forward. Future analysis should seek to compare this model’s accuracy to other models’ accuracy and in sample metrics. A better model could combine different types of models for different states, depending on the best predictors for each state. With regards to ad spending, it seems unlikely that Trump will be able to outspend Biden in the coming weeks in Florida or Wisconsin, given Biden’s current lead in spending. However, it is worth keeping an eye on how these numbers might change and influence the election in key swing states.