Incumbency, Federal Spending, and Covid-19 Aid
October 3, 2020
Introduction
Going back to the idea of retrospective voting explored in my economy post, this week’s blog post will investigate how voters reward incumbents for allocating federal funds to their home areas. I will summarise a state level model developed by Douglas Kriner and Andrew Reeves in 2012 and then discuss how that model can be used to think about the impacts of Covid-19 aid on the 2020 election.
Kriner and Reeves Model
In their 2012 paper “The Influence of Federal Spending on Presidential Elections,” Kriner and Reeves find a positive relationship between an increase in federal spending at a state level and vote share for an incumbent president. Some of their key findings are as follows:
- On average, for every percent increase in federal spending between years, there is an increase in popular vote share for the incumbent
- This relationship is much stronger in competitive states (defined as states where the loser’s popular vote share averaged to be >= 45% in the past three elections) than non-competive states
- For competitive states, their model calculated a .02 increase in popular vote share for every 1% increase in federal spending between years
- For non-competitive states, this coefficient was .008
- In line with this finding, incumbents typically direct more federal spending to swing states during both election and non-election years
In summary, Kriner and Reeves’ work demonstrates that when more money goes to states, thoses states tend to vote more for the incumbent than they otherwise would have (especially in competitive states). Although Covid-19 aid is different than general federal spending, it is not too far of a stretch to apply the principles of Kriner and Reeve’s work to estimate the effect of pandemic aid on the election.
Covid-19 Aid
The maps below show the total and per-case Covid-19 federal aid for each state. I chose to include the per-case numbers as it standardizes values across smaller and larger states to make them more comparable.
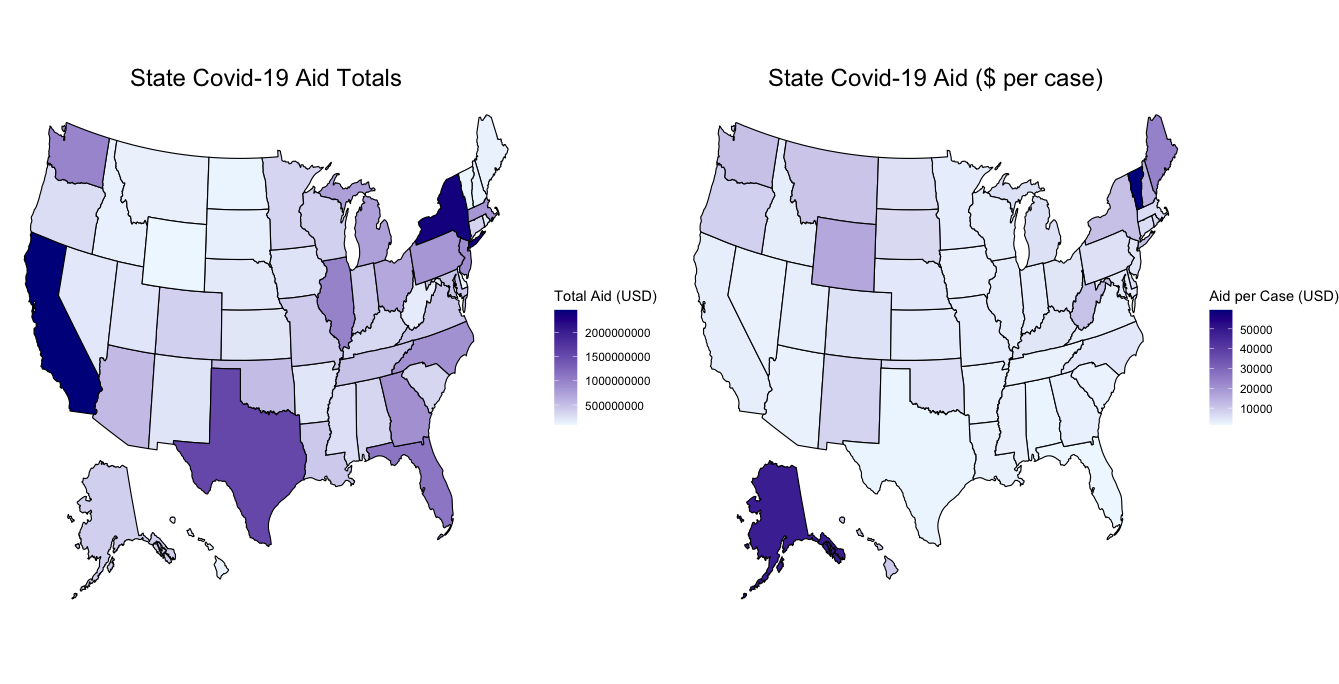
As we can see, although some states received vastly more total Covid-19 aid, the numbers are much closer on a per-case basis. For this reason, the rest of this blog post’s analysis will use the aid per case numbers.
Competitive vs. Non-Competitive States
Per Kriner and Reeves’ findings, I thought it was possible that competitive states received more funding per case than non competitive states. However, after looking at the data, that doesn’t appear to be the case. See the boxplot below for this comparison.
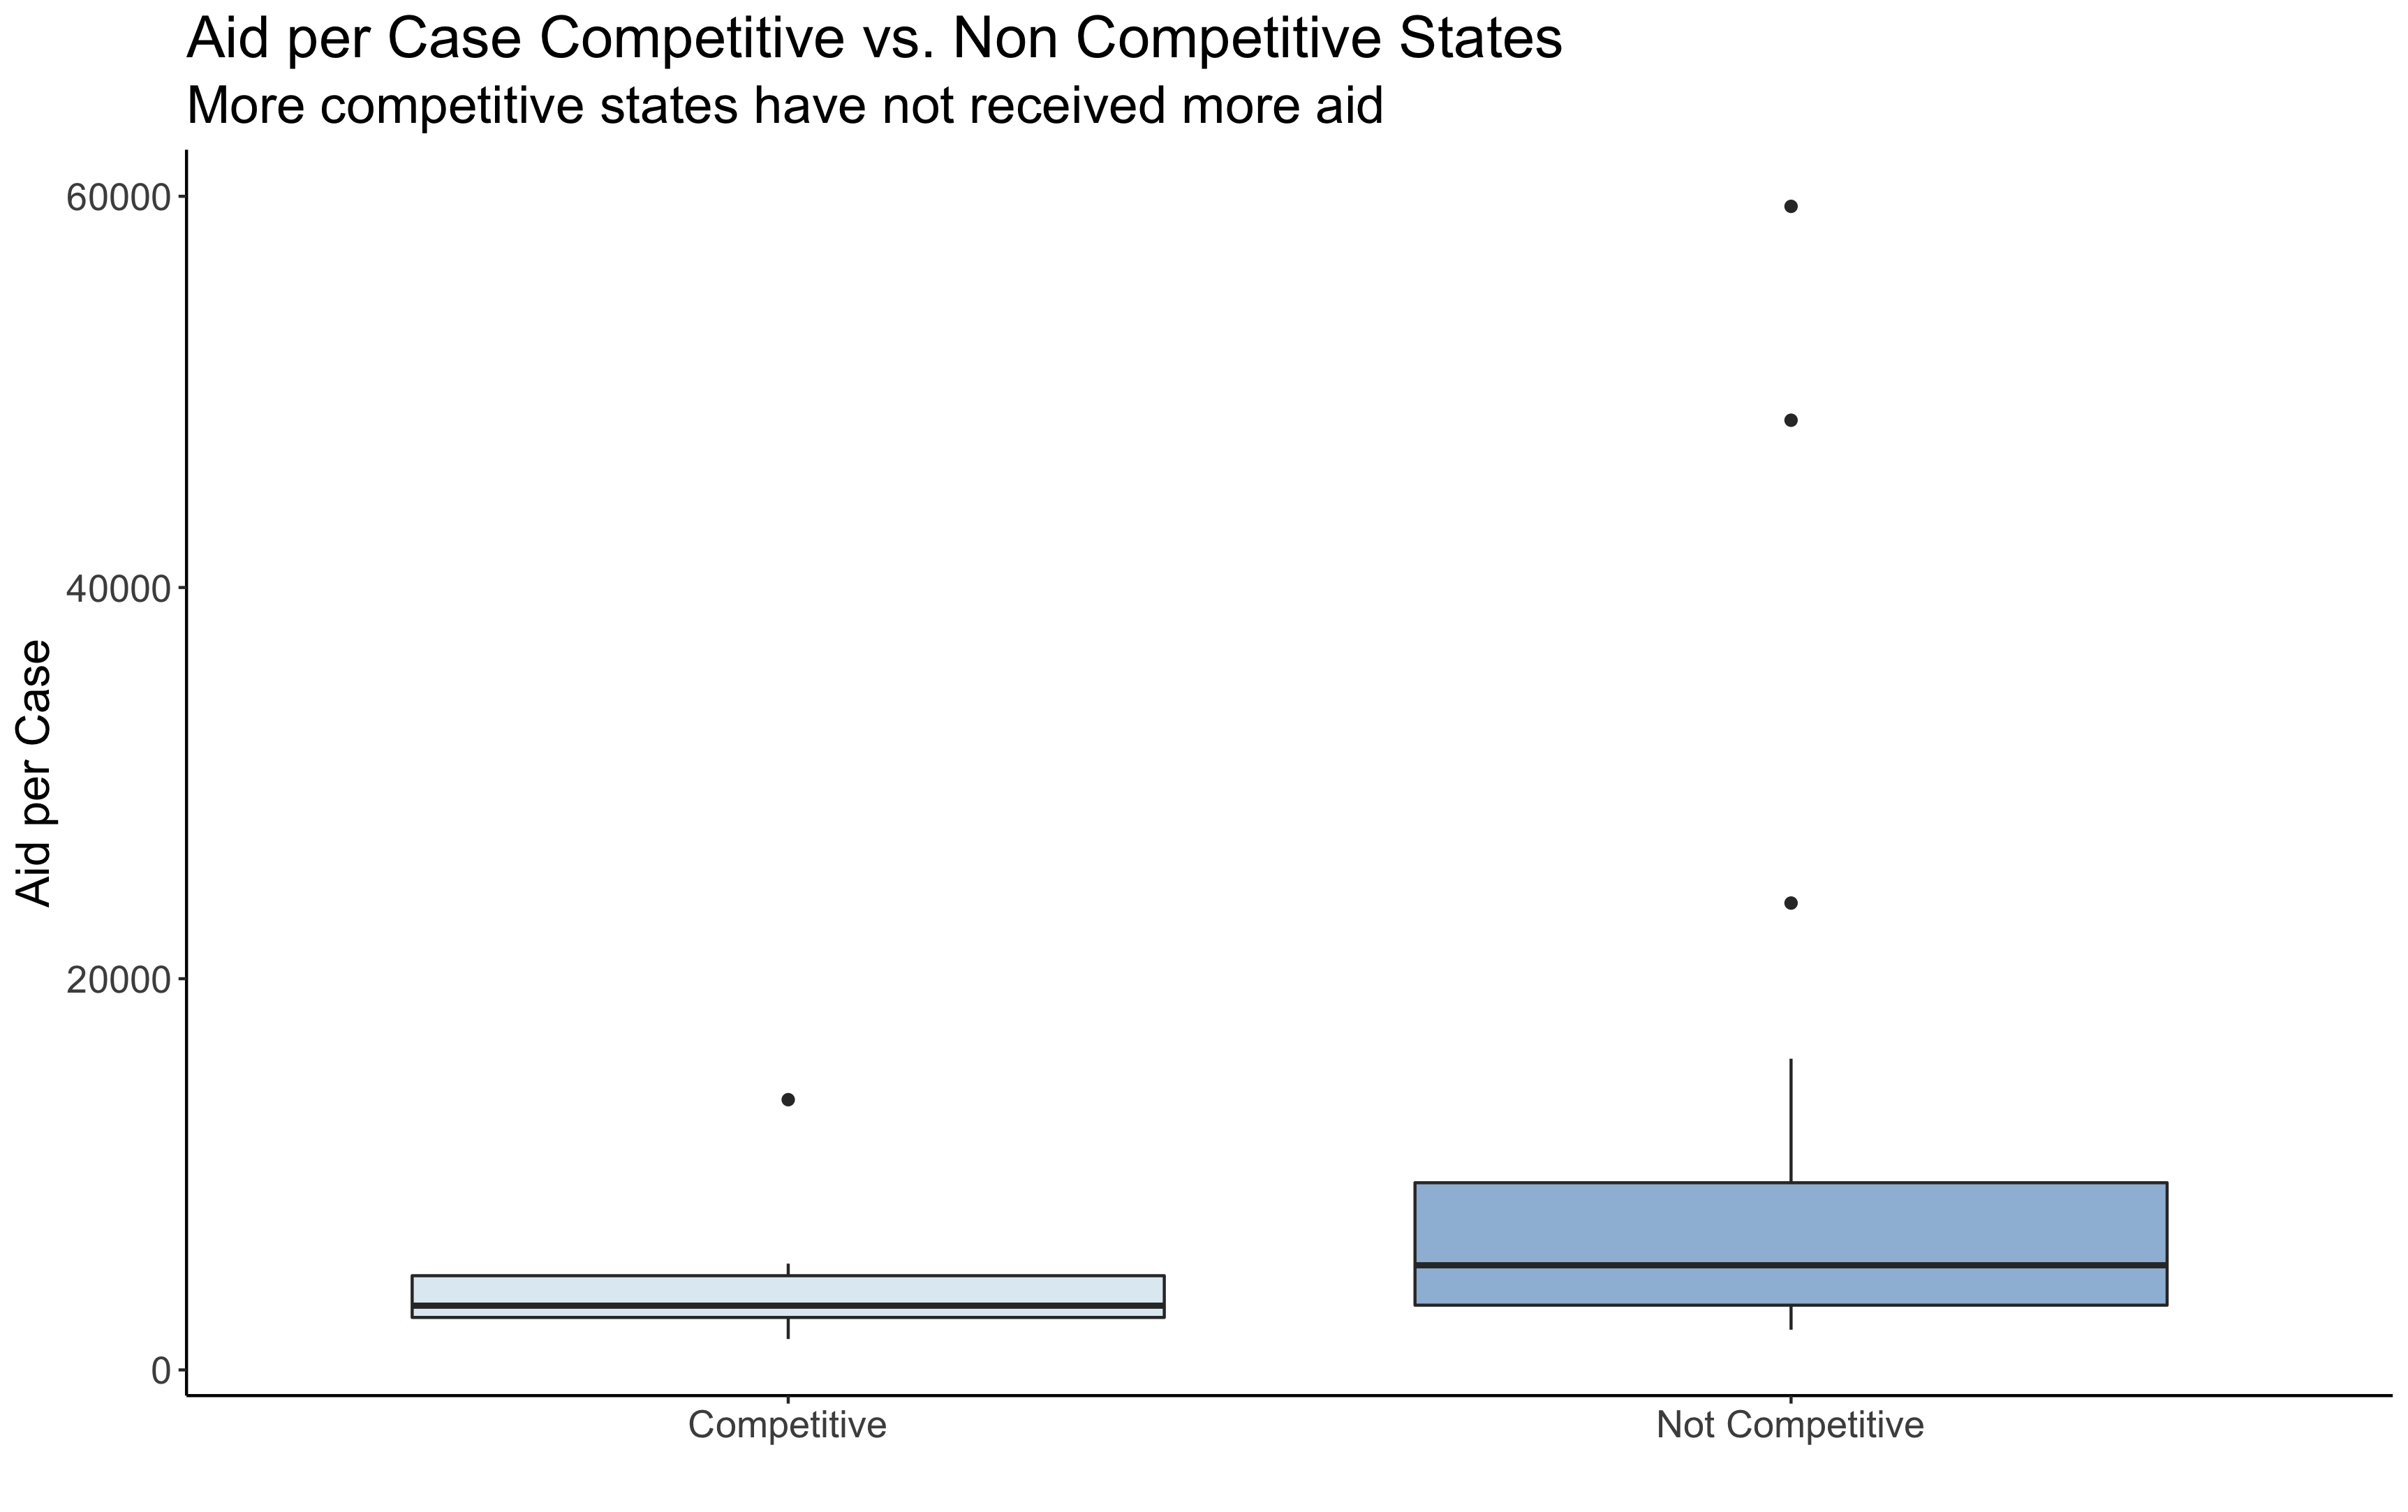
Note: competitive states were determined by the same criteria as above (states where the loser’s popular vote share averaged to be >= 45% in the past three elections). For 2020, those states are Arizona, Colorado, Florida, Georgia, Iowa, Michigan, Minnesota, Missouri, Nevada, New Hampshire, North Carolina, Ohio, Pennsylvania, Virginia, and Wisconsin.
In my opinion, the fact that competitive states have not received more aid per case is encouraging, as it suggests that Trump didn’t try to manipulate the election with pandemic aid.
Estimating the Effect of Aid on Vote Share
Going off of Kriner and Reeves’ model, I would expect that increased federal funding in the form of Covid-19 aid will have an effect on the election.
Note: Because there is no historical data to compare Covid-19 aid to, it is impossible to run a regression and mathematically calculate this predicted effect. Thus, the estimates below only reflect my own reasoning and logic.
Competitive State Coefficients
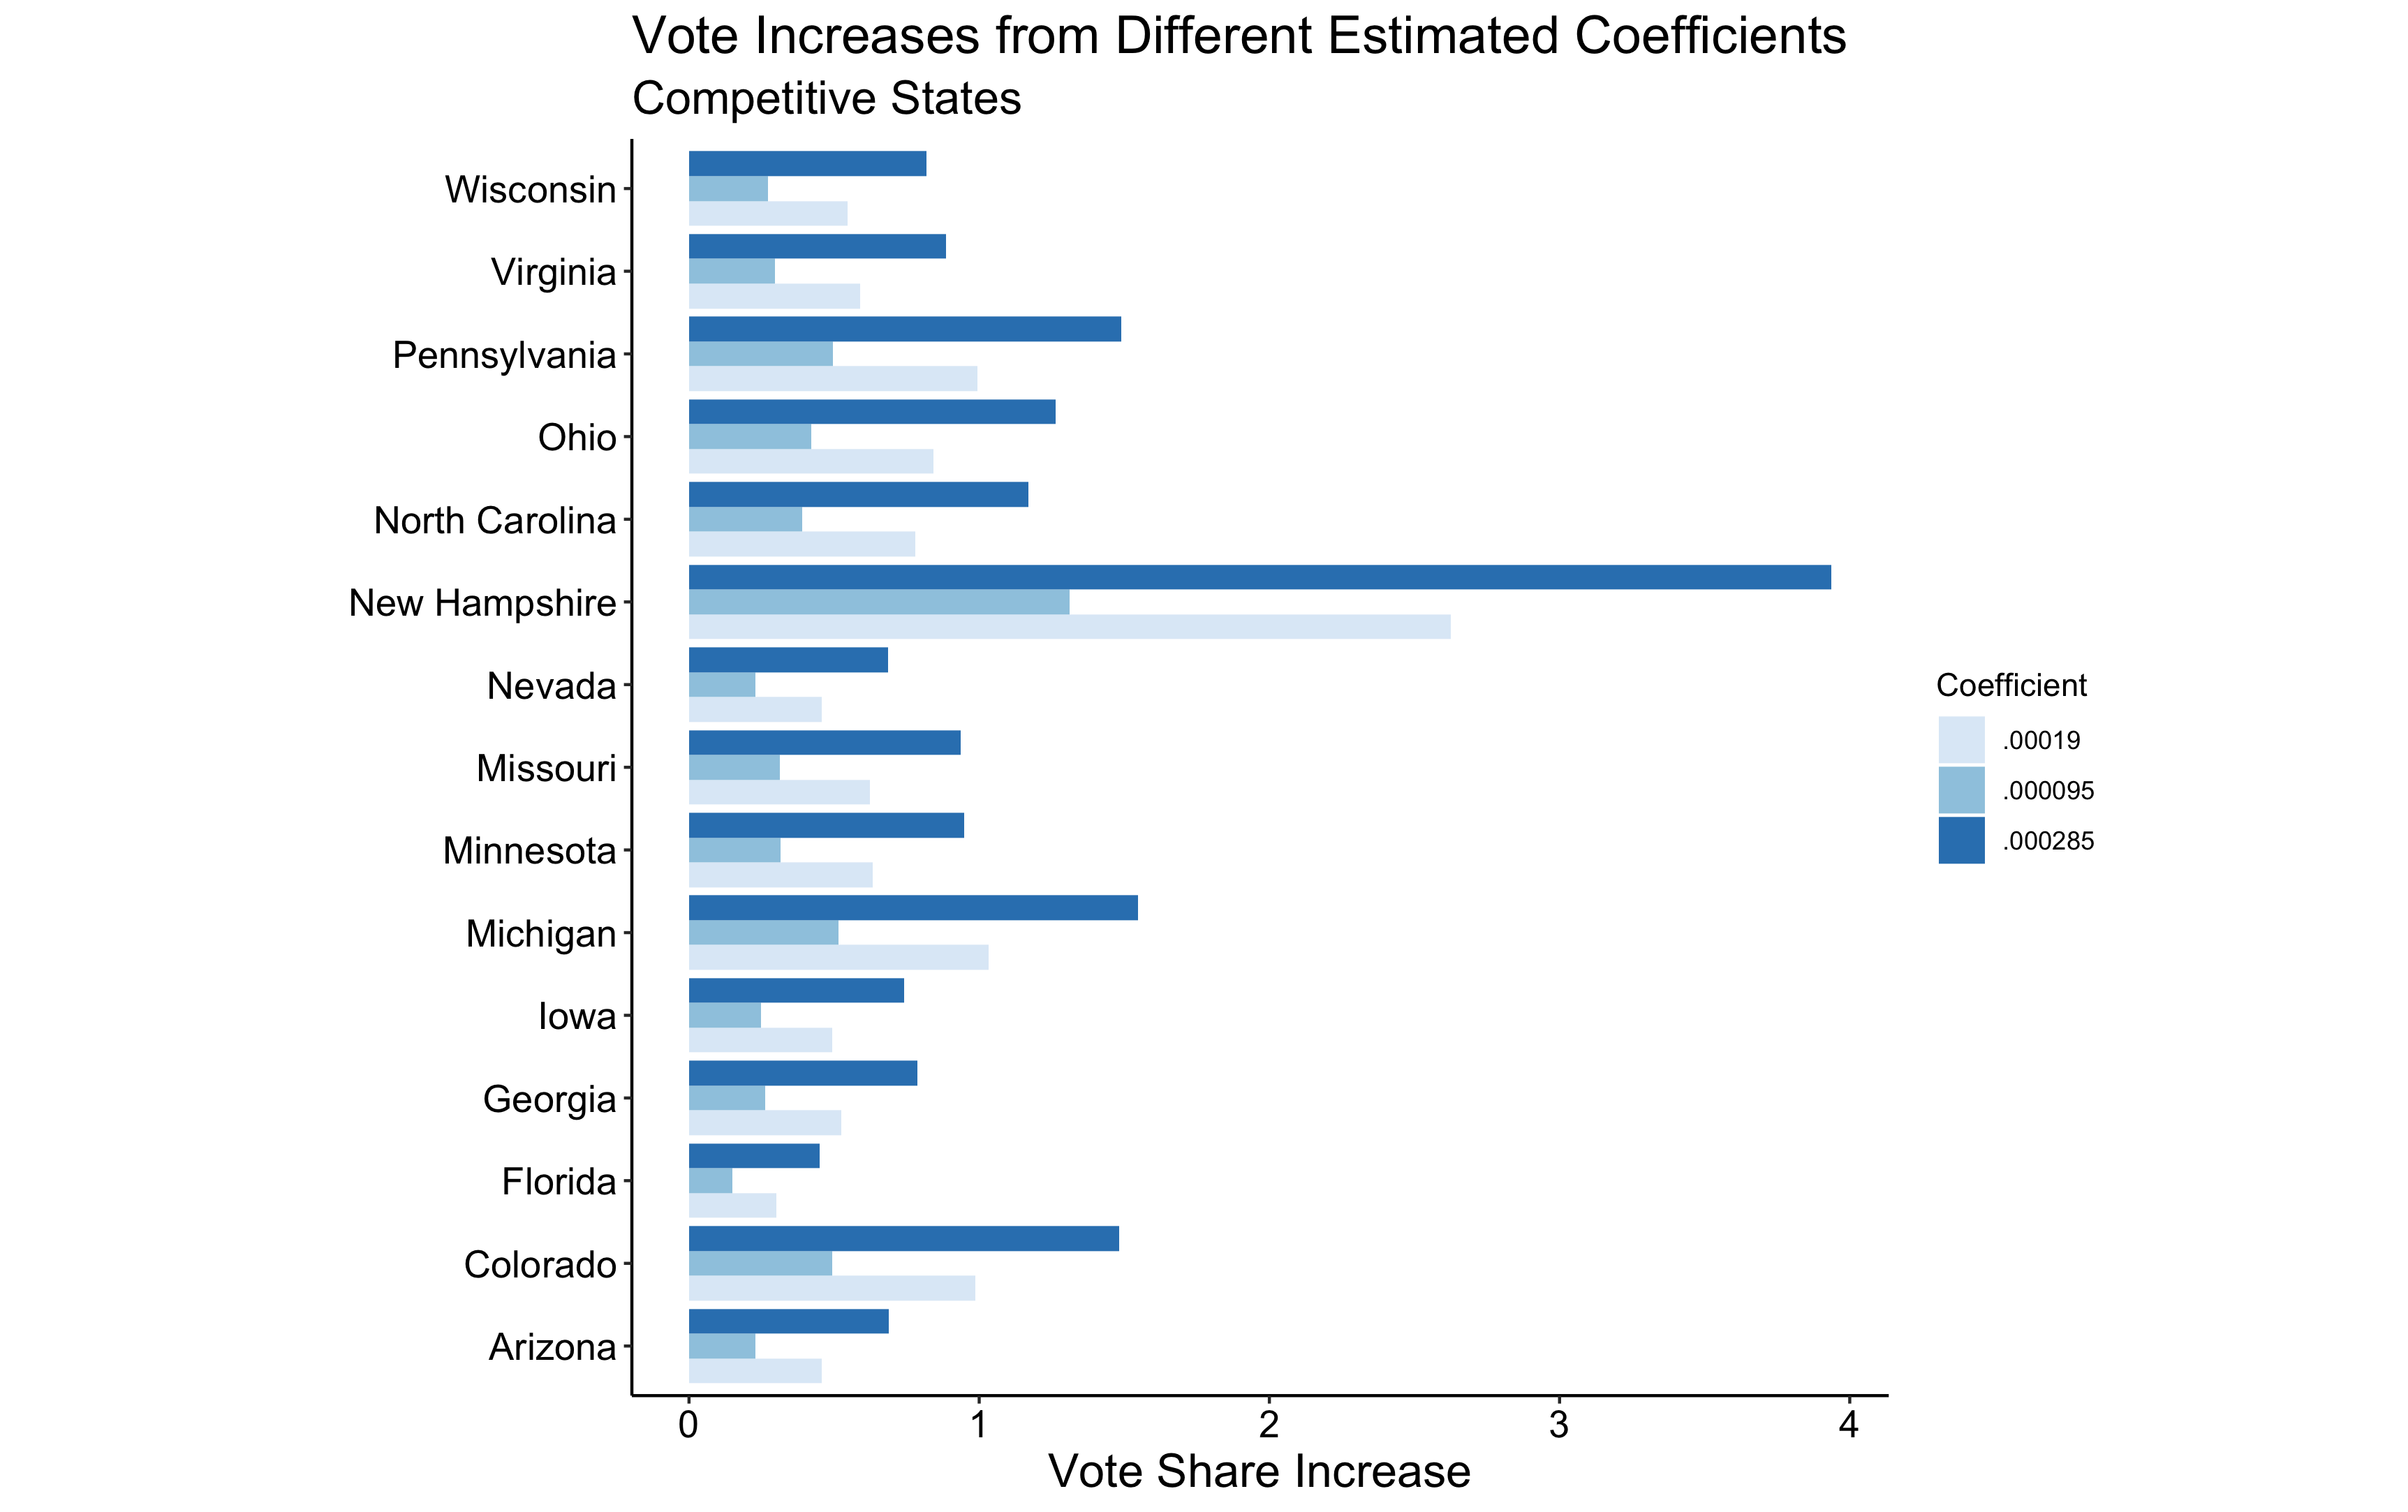
I considered three different estimated coefficeints for competitive states:
.000095, .00019, and .000285.
I calculated the base case coefficient (.00019) by assuming that the average amount of Covid-19 aid will result
in about a 1.5% vote share increase for Trump. The mean aid per case amongst all states = 7624.52. Using the formula:
coefficient = 1.5/7624.52
I calculated the base coefficeint to be .00019. I then calculated a more conservative coefficient about 50% less than that value
(.000095) and a less conservative coefficient 50% more than that value (.000285).
The graphic below visualises how these estimates translate into a voting bump for Trump.
Non-Competitive State Coefficients
In Kriner and Reeves’ model, the non-competitive state coefficient equalled 40% of the competitive state
coefficient. I followed this guildline to calculate my estimates for the non-competitive state
coefficient. Using the formula:
non-competitive_coeff = .4 x competitive_coeff
I calculated the base coefficient to be .000076, the more conservative coefficient to be .0000038,
and the less conservatiive coefficient to be .00011.
Incorporating Covid-19 Effect into a Prediction
I incorporated these estimates into last week’s poll model to see how the different
estimates influence predicted election results.
For each of the three above estimated coefficients,
I calculated the updated vote share in each state for Trump with this equation:
vote_share = (state_regression_coeff)*(avg_support) + (covid_coeff_estimate)*(aid_per_case).
The vote share for Biden isn’t changed by this update.
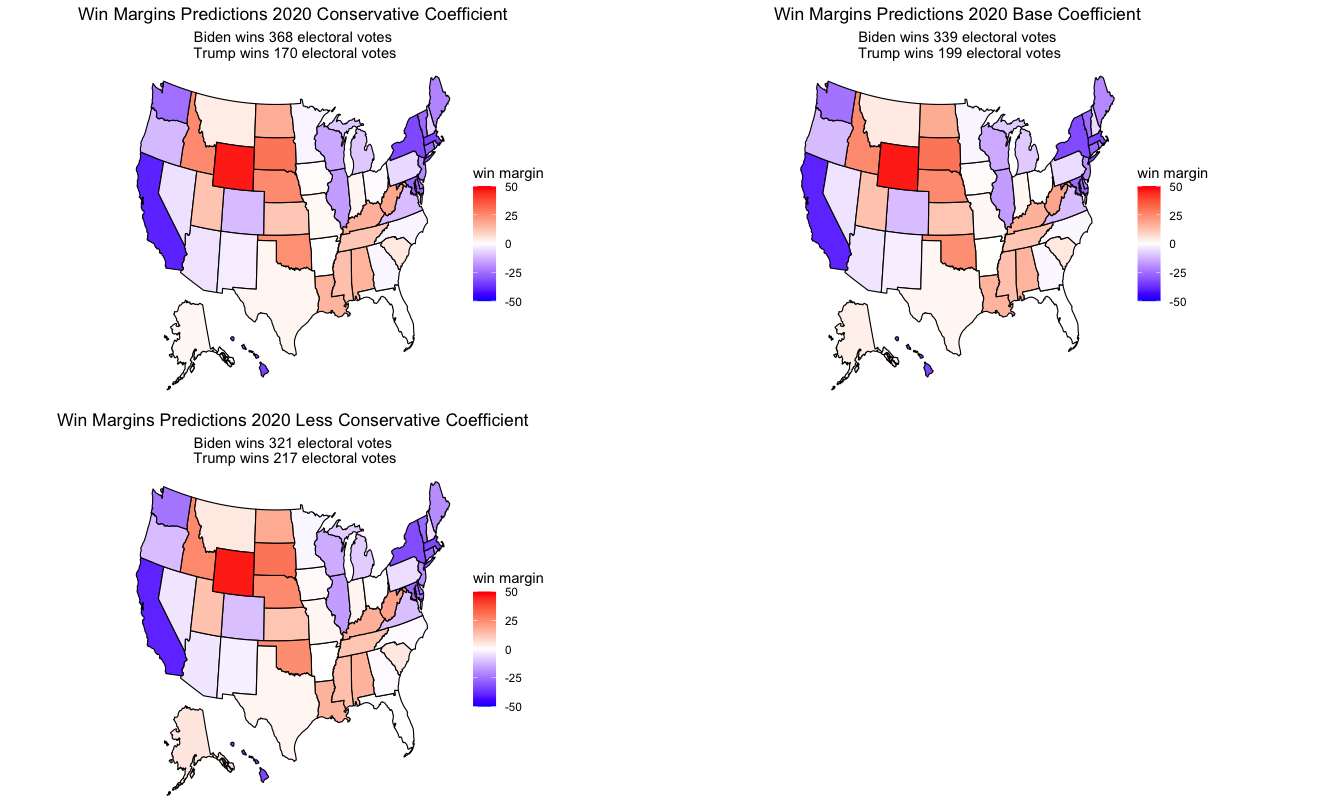
The results of the poll/covid model is shown below for each of the different estimated coefficients.
Analysis
- Incorporating Covid-19 aid into the model changes the prediction results from the original poll model
- Biden wins in every scenario, but the prediction results vary across the different coefficients
- The conservative coefficient model predicts Biden wins Florida (29 electoral votes) while both the base and less conservative coefficient models predict Trump wins Florida by a slim margin
- The less conservative model also predicts that Trump wins Ohio (18 electoral votes)
Conclusion
Incorporating Covid-19 aid into the model allows us to think about how the pandemic will potentially affect the election. Of course, looking at federal spending is just one aspect of how the pandemic will potentially affect the election. However, I believe it is a very important to consider how this increased federal spending could be a potential positive for Trump, when so many other impacts of the pandemic (see the economy) will mostly likely be negative for Trump’s reelection bid.